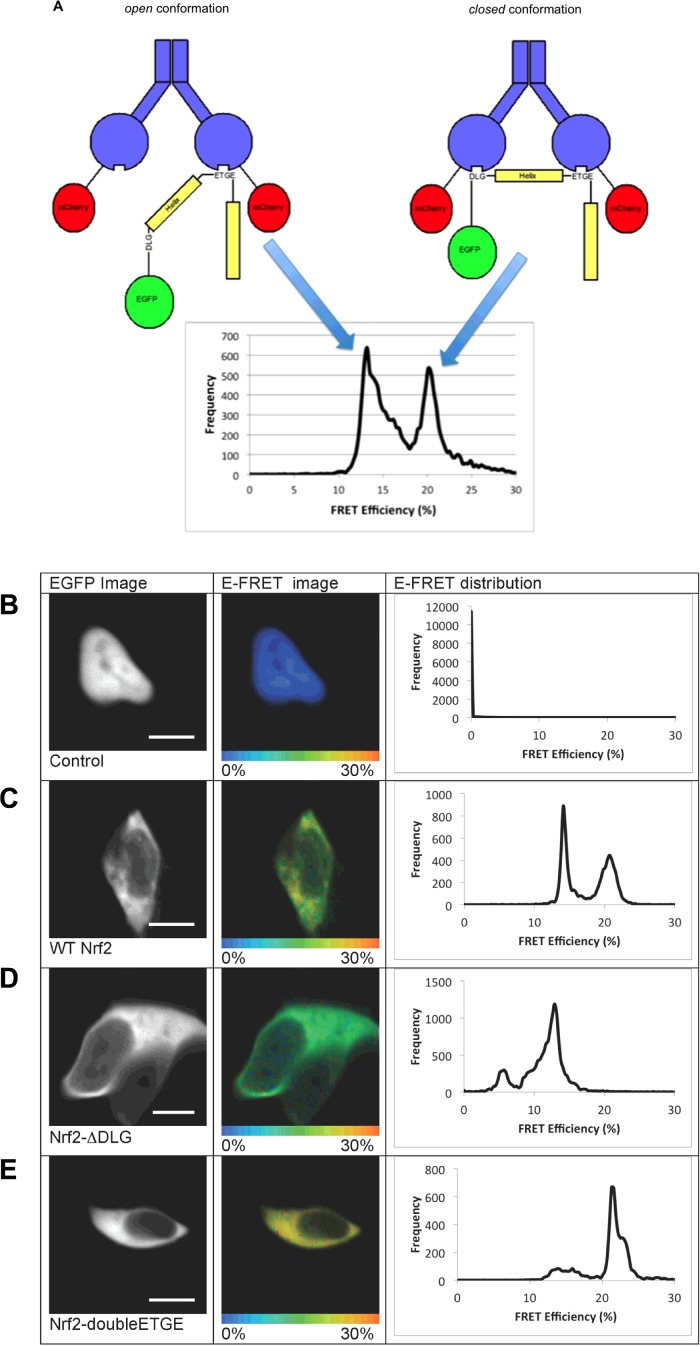
Figure 1. Single-cell analysis of the Keap1-Nrf2 interactions.
(A) The ‘open’ and ‘closed’ conformations of the Keap1–Nrf2 complex. The interactions between Keap1 and Nrf2 are shown schematically above the E-FRET distribution. In the images, Keap1 is shown in blue, mCherry in red, Nrf2 in yellow and EGFP in green. On the left, the Keap1–Nrf2 complex is shown in the ‘open’ conformation, in which only the ‘ETGE’ motif of Nrf2 is bound to the Keap1 dimer. This conformation generates the 13% E-FRET population shown in the graph. On the right, the ‘closed’ conformation is shown, where both the ‘DLG’ and ‘ETGE’ motifs of Nrf2 are bound to the Keap1 dimer. This conformation generates the 21% E-FRET population shown below in the graph. (B–E) Human embryonic kidney (HEK)293 cells were imaged 24 h after co-transfection with: WT EGFP–Nrf2 + mCherry (B), WT EGFP–Nrf2 + Keap1–mCherry (C), EGFP–Nrf2ΔDLG + Keap1–mCherry (D) or EGFP–Nrf2 double ETGE + Keap1–mCherry (E). The left columns show the EGFP image. The middle columns show pictorial representations of the E-FRET, where the colour of the cell corresponds to the E-FRET, ranging from 0% to 30%. The right columns show the E-FRET data from each pixel of the image plotted on a graph. The E-FRET in a cell co-transfected with WT EGFP–Nrf2 + free mCherry (B) is 0, corresponding to the blue colour of the cell. The E-FRET distribution in a cell co-transfected with WT EGFP–Nrf2 + Keap1–mCherry (C) shows two distinct peaks, one centred at 13% and the other at 21%, suggesting that there are two different FRET interactions between the EGFP and mCherry fluorophores within the Keap1–Nrf2 complex. These E-FRET populations are shown pictorially in the middle column of (C), where both green and yellow colours can be seen. The E-FRET distribution in a cell co-transfected with EGFP–Nrf2ΔDLG + Keap1–mCherry (D) shows one major peak centred at 13%, indicating that there is a single interaction between the EGFP and mCherry fluorophores within the Keap1–Nrf2ΔDLG complex. This E-FRET population is shown pictorially in the middle column of (D), where the green colour is distributed evenly across the cell. The E-FRET distribution in a cell co-transfected with EGFP–Nrf2 double ETGE + Keap1–mCherry (E) shows one major peak centred at 21%, indicating that there is one major interaction between the EGFP and mCherry fluorophores within the Keap1–Nrf2 double ETGE complex. This E-FRET population is shown pictorially in the middle column of (E), where the predominant colour is yellow. Scale bar=10 μm.

