
Figure 3.
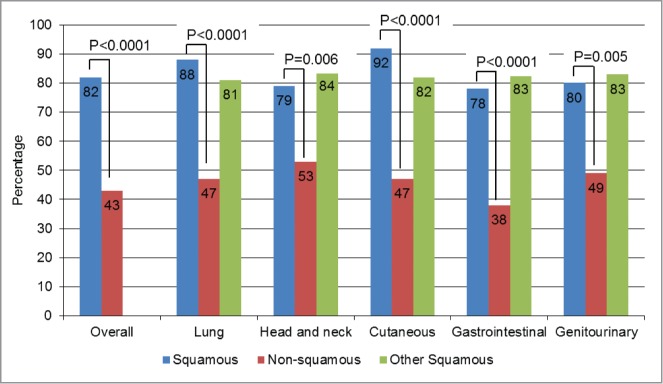
Squamousness signature frequency: comparison by histology. For this analysis, one point (cumulative) was given for each of the genes where abnormalities were more prevalent in squamous tumors–TP53, PIK3CA, CCND1, CDKN2A, SOX2, NOTCH1, and FBXW7– each time they were present. Because KRAS aberrations were significantly less prevalent in squamous tumors, 1 point was also assigned for the absence of KRAS. The numbers were then added up for each case. Overall, squamous cases had a median of 3 points versus only 1 point for non-squamous cases, P < 0.0001. In this bar graph, we represented the percentages of patients with ≥2 points (2 points was the median for the overall population (squamous and non-squamous cases)). All the P-values comparing squamous (blue bars) vs. non-squamous cases (red bars) were ≤0 .006. When comparing squamous tumors of a particular histology with all other squamous tumors (blue versus green bars), no significant differences were seen. For details on numbers and P-values refer to Table S2.