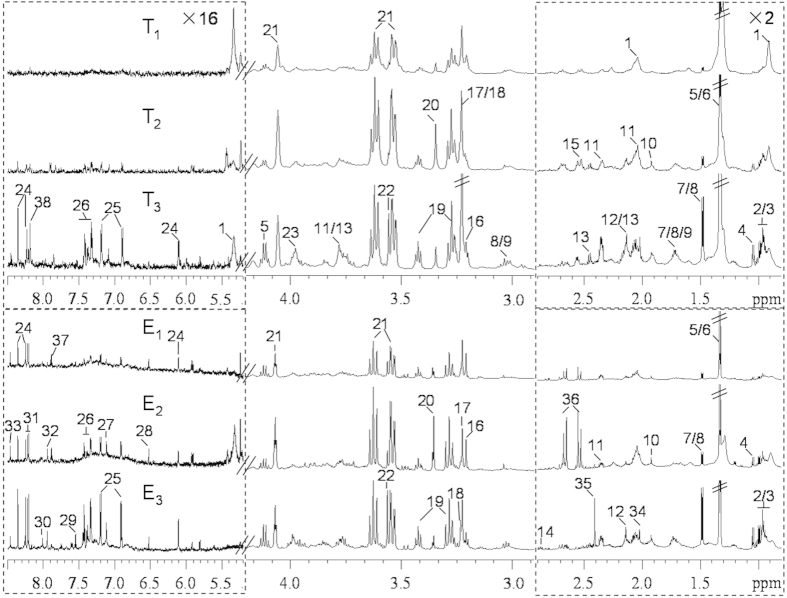
Figure 2. Representative 600 MHz 1H spectra of intact thyroid tissue (T) and tissue aqueous extracts (E) originating from healthy adjacent thyroid tissue (T1, E1), benign thyroid lesion (T2, E2) and malignant thyroid lesion (T3, E3).
The regions of δ 0.8–2.9 and δ 5.2–8.5 were vertically expanded 2 and 16 times compared with the region of δ 2.9–4.2. Keys: 1, lipid; 2, isoleucine; 3, leucine; 4, valine; 5, lactate; 6, threonine; 7, alanine; 8, lysine; 9, arginine; 10, acetate; 11, glutamate; 12, methionine; 13, glutamine; 14, aspartate; 15, glutathione (GSH); 16, choline; 17, phosphocholine (PC); 18, glycerophosphocholine (GPC); 19, taurine; 20, scyllo-inositol; 21, myo-inositol; 22, glycine; 23, phosphoethanolamine (PE); 24, inosine; 25, tyrosine; 26, phenylalaine; 27, histidine; 28, fumurate; 29, uracil; 30, guanosine; 31, hypoxanthine; 32, xanthine; 33, formate; 34, acetamide; 35, succinate; 36, citrate; 37, uridine; 38, U1.

