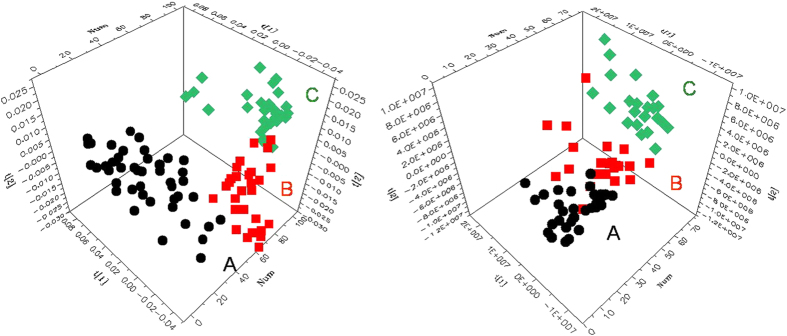
Figure 3. 3D PCA scores plots obtained from NMR data of intact thyroid tissues (left) and tissue aqueous extracts (right).

(A) healthy adjacent thyroid tissues ( ), (B) benign thyroid lesions (
 ), (C) malignant thyroid lesions (
 ). Benign groups: NG and FA. Malignant groups: PTC.
