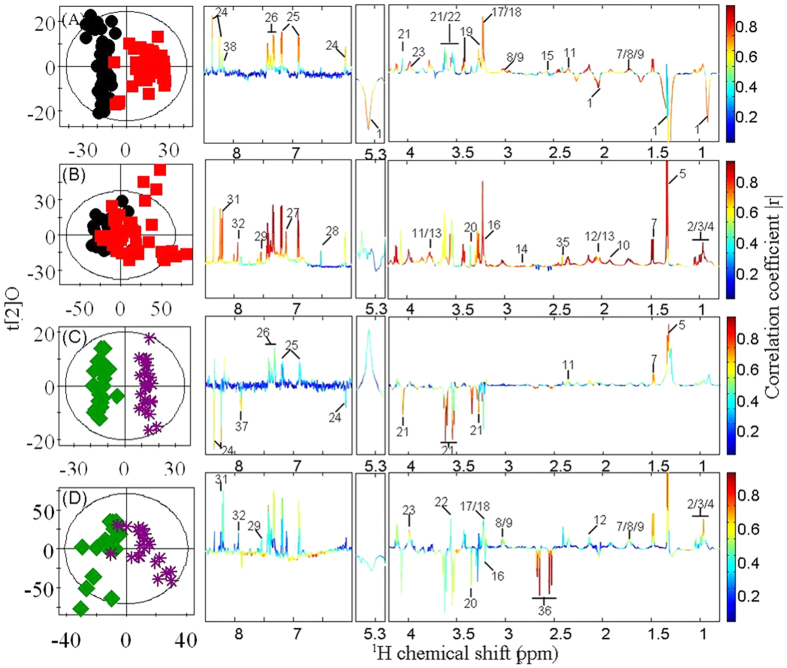
Figure 5.
OPLS-DA scores plots (left) and coefficient plots (right) generated from 1H NMR spectra of intact thyroid tissue (A,C) and tissue aqueous extracts (B,D) showing the discrimination between healthy adjacent thyroid tissue ( ), thyroid lesions (
 ), benign thyroid lesions (
 ) and malignant thyroid lesions (
 ). Key to metabolite is given in Table 1.

