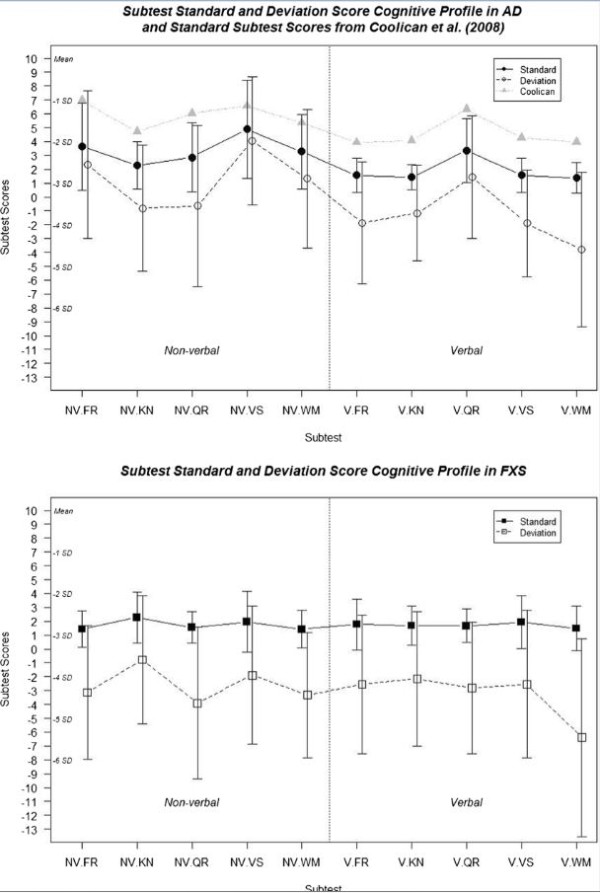
Figure 4.

Profile of standardized and deviation (z) subtest scores by diagnosis group (mean ± SD). FR, fluid reasoning; KN, knowledge; NV, non-verbal; QR, quantitative reasoning; V, verbal; VS, visual spatial processing; WM, working memory.

Profile of standardized and deviation (z) subtest scores by diagnosis group (mean ± SD). FR, fluid reasoning; KN, knowledge; NV, non-verbal; QR, quantitative reasoning; V, verbal; VS, visual spatial processing; WM, working memory.