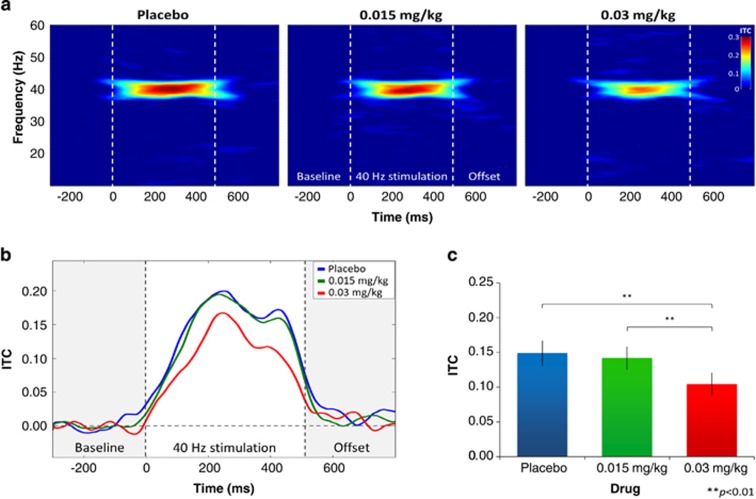
Figure 1.
The 40 Hz intertrial coherence (ITC) per drug condition at electrode Cz. (a) Hilbert transform-based time–frequency plots for ITC (for details, see Supplementary Text 1). From left to right, the plots show the group-averaged time–frequency plots of the placebo, 0.015 mg/kg, and 0.03 mg/kg conditions during 40 Hz stimulation at electrode Cz. (b) Time course of the group-averaged ITC per drug condition at electrode Cz. The blue line represents the ITC of the placebo condition, whereas the green and red lines represent the ITC of the 0.015 and 0.03 mg/kg doses, respectively. (c) ITC (mean±SEM) by drug condition at electrode Cz during the time interval 50–550 ms after stimulation onset. **: Significant differences (pAdj<0.01) between drug conditions.

