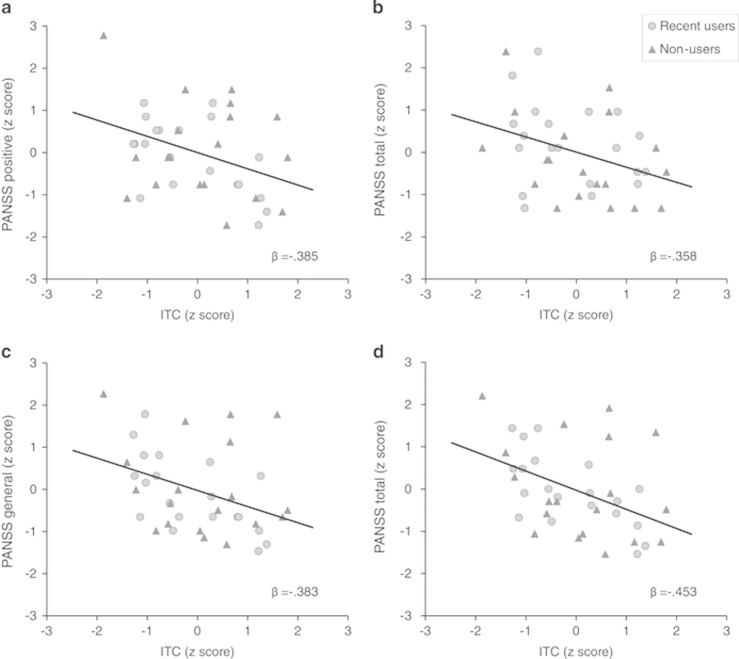
Figure 2.
Relationship between 40 Hz intertrial coherence (ITC) and psychosis-relevant measures under the effects of Δ9-THC. The scatter plots show the z-normalized values of the 40 Hz ITC (x axes) versus the PANSS (a) positive, (b) negative, (c) general, and (d) total scores (y axes) under the effects of Δ9-THC. The relationship between the variables is represented by the regression lines and the standardized regression coefficients (β). Data from recent users (past 30 days) and nonusers of cannabis are depicted as circles and triangles, respectively.

