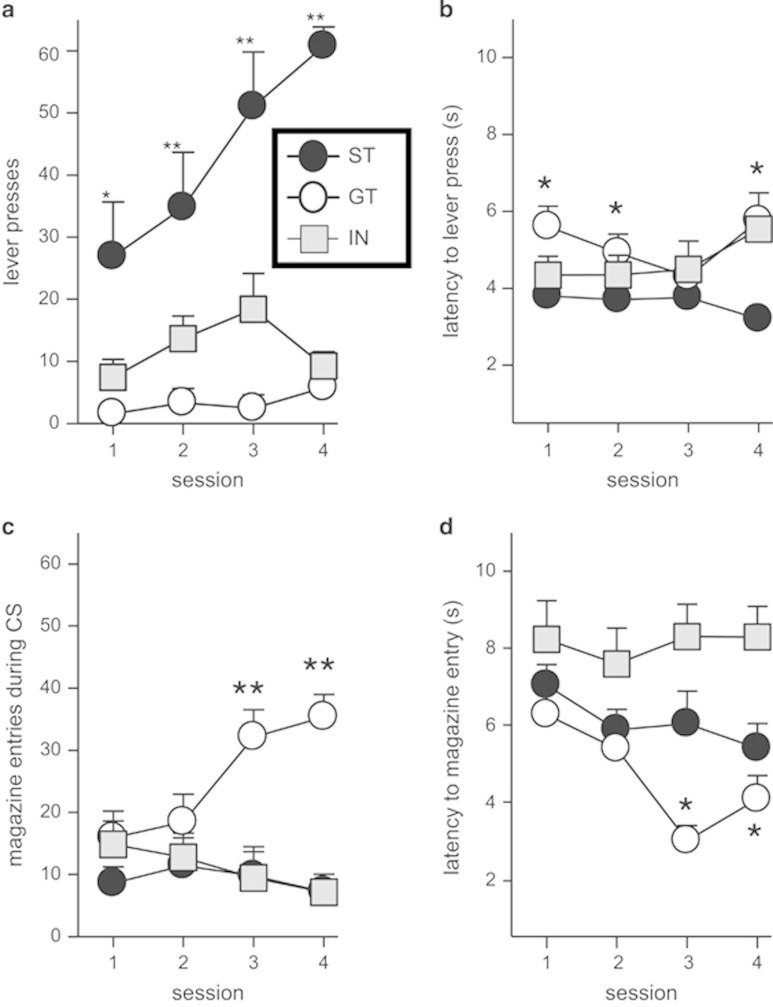
Figure 1.
Performance in sign trackers (n=9; black circles), goal trackers (n=9; white circles), and intermediate groups (n=27; gray squares). (a) Sign trackers pressed the lever during CS presentation more frequently than goal trackers and showed a steady increase in lever presses across sessions. The symbols (open circles for GT, black circles for ST, and gray squares for IN) apply to all panels in the figure. (b) Plot illustrating latencies to lever press across sessions in all three groups. There was no difference among groups. (c) Goal trackers showed a significant increase in average magazine entries over sessions. (d) Plot illustrating latencies to magazine entry across sessions in all groups. Goal trackers showed a faster magazine in the later sessions compared with sign trackers. The IN group did not show a bias towards approaching levers or magazines. In this and subsequent figures, error bars represent SEM. Asterisk indicates significant differences between ST and GT performance; *p<0.05; **p<0.01.

