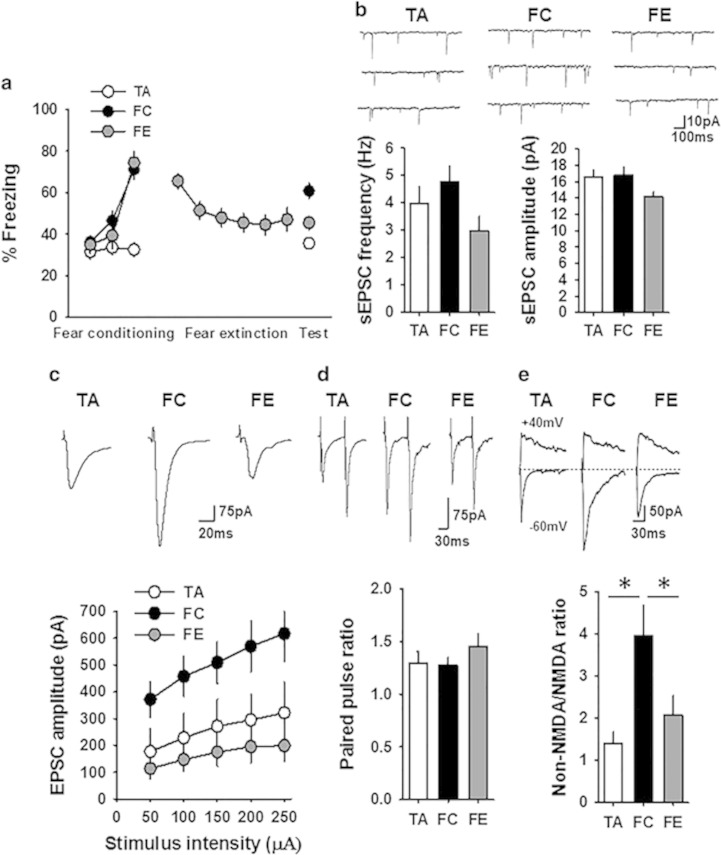
Figure 4.
Fear-dependent synaptic plasticity in the CEm neurons. (a) Percentage freezing in tone-alone (TA, 28 mice), fear-conditioned (FC, 31 mice), and fear extinction (FE, 27 mice) groups on days 1 (fear conditioning or tone alone), 2 (fear extinction learning, data points are average of 5 successive recordings), and 3 (fear recall test) of the experiment. (b) Frequency and amplitude of sEPSCs in the CEm neurons of TA (18 neurons/7 mice), FC (22 neurons/10 mice), and FE (21 neurons/9 mice) groups. Upper panel shows examples of sEPSCs. (c) EPSC amplitude in the CEm neurons of TA (15 neurons/7 mice), FC (20 neurons/10 mice), and FE (22 neurons/9 mice) groups. Upper panel shows examples of EPSCs. (d) Paired pulse ratio of non-NMDA EPSCs in TA (17 neurons/6 mice), FC (15 neurons/5 mice), and FE (15 neurons/5 mice) groups. Upper panel shows examples of EPSCs evoked at an interval of 60 ms. (e) Non-NMDA/NMDA ratio in the CEm neurons from TA (9 neurons/3 mice), FC (9 neurons/3 mice), and FE (9 neurons/3 mice) groups. Upper panel shows examples of EPSCs evoked at −60 mV and +40 mV.Asterisk denotes a statistically significant difference.

