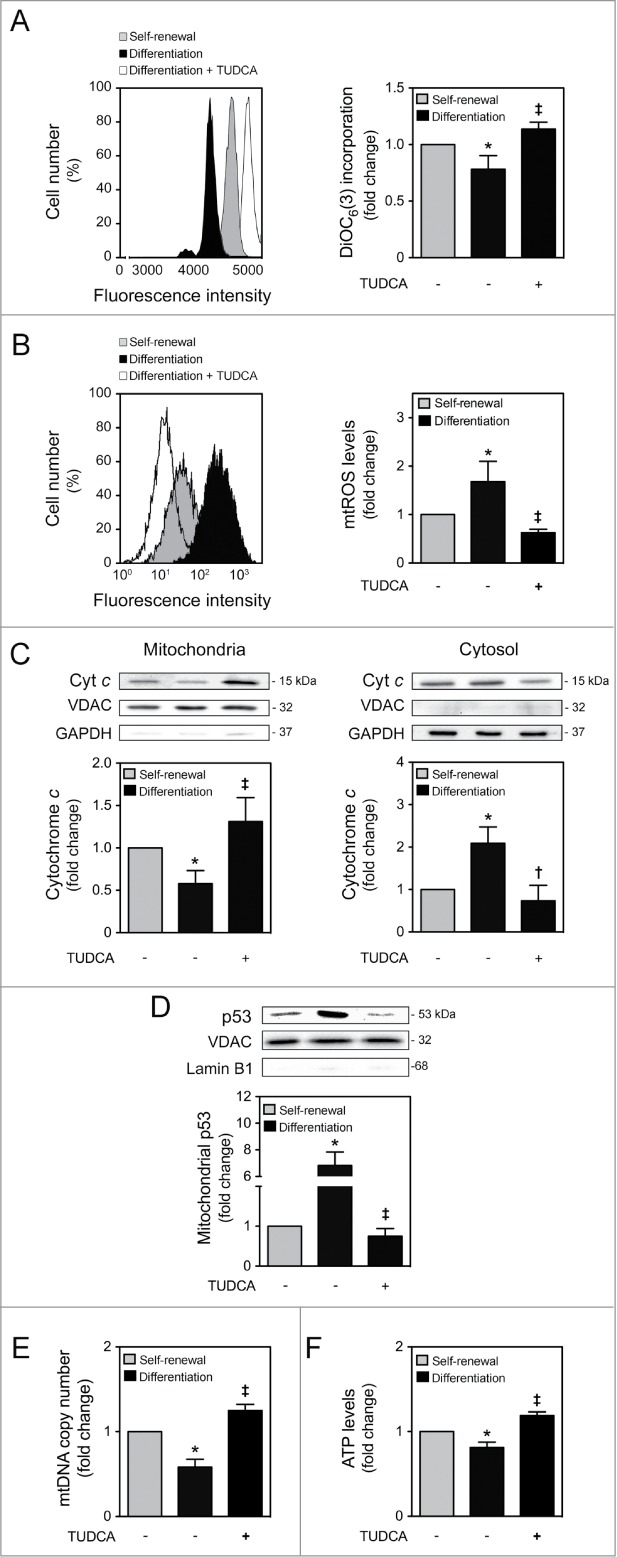
Figure 1.

TUDCA modulation of NSC differentiation-induced mitochondrial alterations. Mouse NSCs were expanded, induced to differentiate in the presence or absence of TUDCA, and then collected for flow cytometry, immunoblotting and quantitative real-time PCR, as described in Materials and Methods. (A) Representative histogram (left) and quantification data (right) of DiOC6(3)-positive cells in self-renewal or at 6 h of differentiation evaluated by flow cytometry. (B) Representative histogram (left) and quantification data (right) of mtROS levels in self-renewal or at 1 h of differentiation, evaluated by FACS, using MitoSOXTM Red reagent. (C) Representative immunoblots of cytochrome c (top) and corresponding densitometry analysis (bottom) in both mitochondria and cytosolic extracts, during self-renewal or at 6 h of differentiation. The mitochondrial and cytosolic fractionation was monitored by the presence of VDAC and GAPDH endogenous protein levels. (D) Representative immunoblots of p53 in mitochondrial extracts (top) and respective quantification data (bottom), in self-renewal or at 6 h of differentiation. Results were normalized to endogenous VDAC protein levels, and nuclear contamination was assessed using Lamin B1 antibody. (E) Real-time PCR analysis of relative mtDNA copy number in self-renewal or at 24 h of differentiation. (F) Representative quantification data of ATP levels in self-renewal or at 24 h of differentiation. Results are expressed as mean ± SEM fold-change for at least 3 different experiments. *P < 0.01 and §P < 0.05 from undifferentiated cells; ‡P < 0.01 and †P < 0.05 from cells treated with TUDCA alone.
