Figure 3.

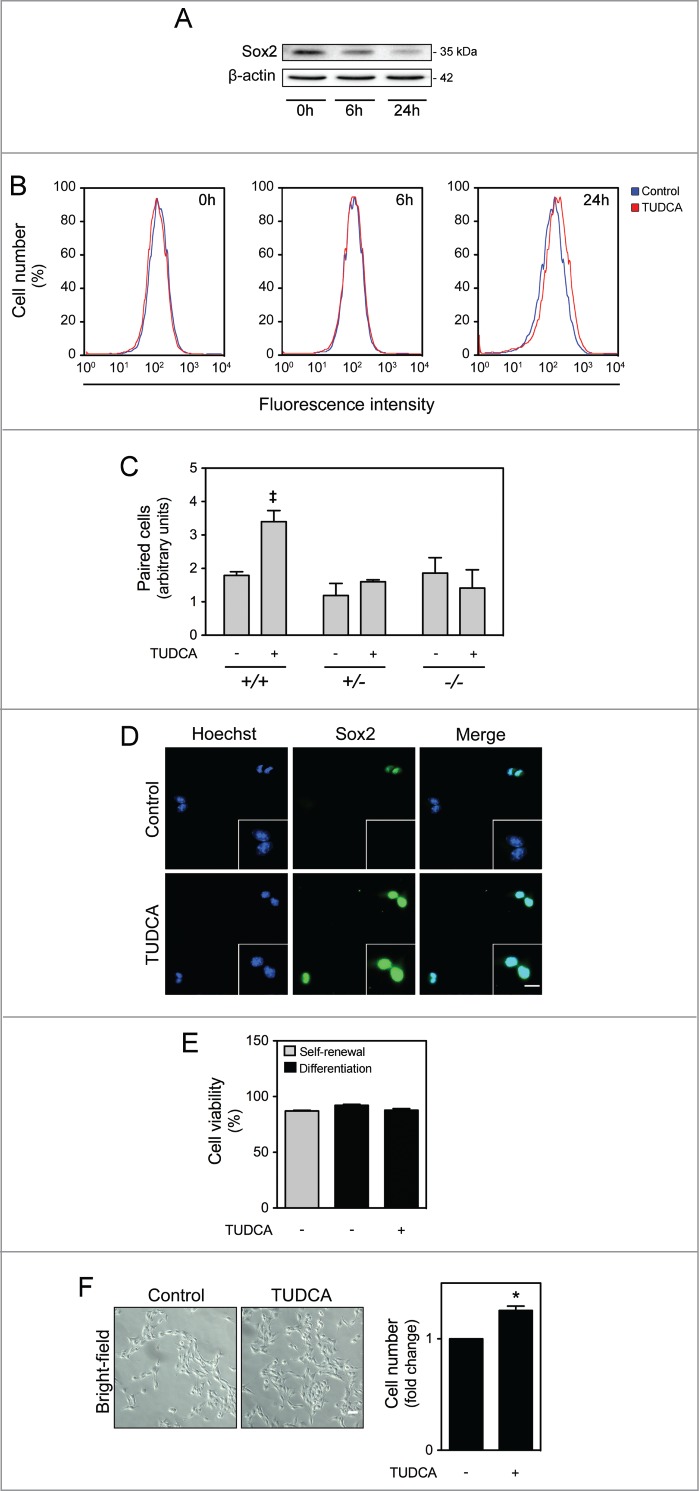
TUDCA modulation of self-renewal and NSC pool. NSCs were expanded and induced to differentiate, in the presence or absence of TUDCA, and then collected for immunoblotting, immunocytochemistry counting and flow cytometry, as described in Materials and Methods. (A) Representative immunoblot of Sox2 in total extracts in self-renewal or at 6 h and 24 h of differentiation. Results were normalized to endogenous β-actin protein levels. (B) Representative histograms of Sox2-positive cells in self-renewal or at 6 and 24 h of differentiation, in the presence or absence of TUDCA, evaluated by flow cytometry. (C) Representative quantification data of paired cells Sox2-positive and -negative, in low EGF/bFGF containing medium, 24 h after TUDCA treatment. (D) Representative microscopy images of undifferentiated NSC pairs labeled with Hoechst 33258 and anti-Sox2 antibody, 24 h after TUDCA treatment. (E) Quantification of NSC viability, by measuring Annexin-V- and PI-negative cells using flow cytometry, in self-renewal or at 24 h of differentiation. (F) Representative bright-field images (left) and quantification of viable cells (right), after 24 h of differentiation. Scale bar, 5 μm and 10 μm (zoom). Results are expressed as mean ± SEM fold-change for at least 3 different experiments. *P < 0.01 from undifferentiated cells; ‡P < 0.01 from cells treated with TUDCA alone.
