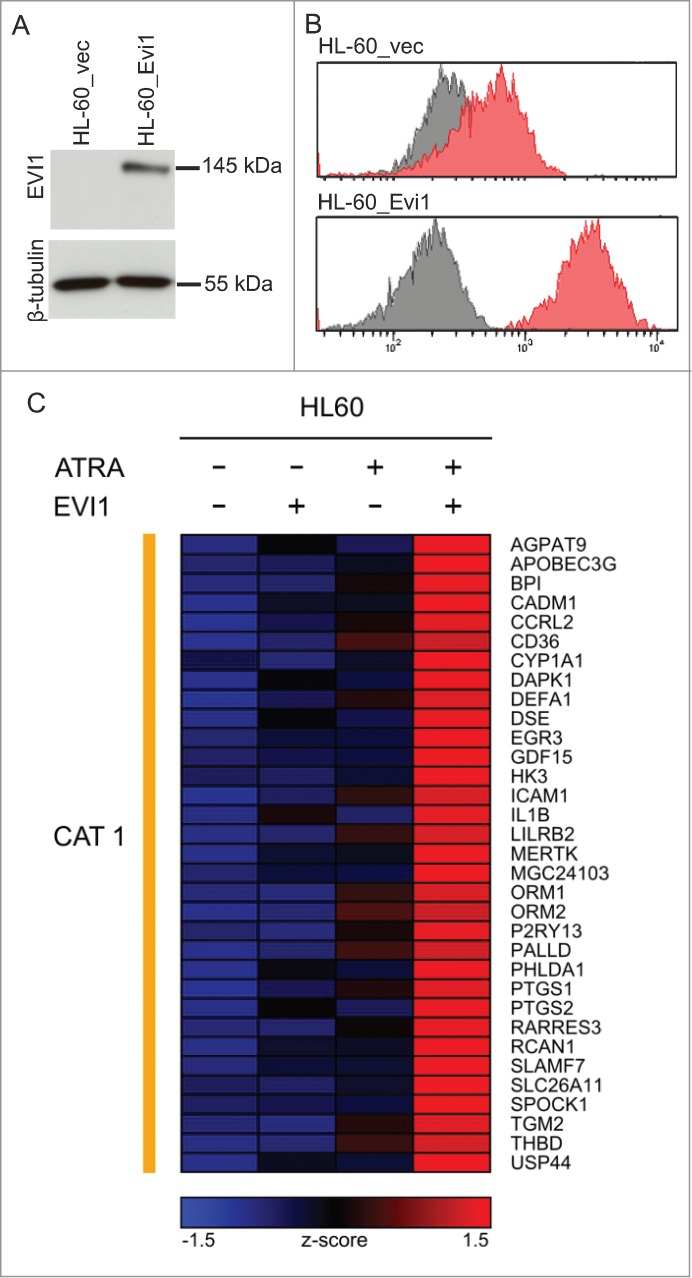
Figure 2.

Evi1 and ATRA cooperatively regulate gene expression in HL-60 cells. (A) Immunoblot analysis demonstrating expression of ectopic Evi1 in HL-60_Evi1 cells. (B) Intranuclear staining and flow cytometry showing expression of ectopic Evi1 in HL-60_Evi1 cells on the single cell level. Red, EVI1 antibody; gray, isotype control. (C) Heatmap representing the expression (z-score) of genes whose induction by ATRA was enhanced by, or observed only in the presence of, Evi1 (category 1, CAT1) in HL-60 cells. In this model system, no genes fulfilled the criteria for inclusion into categories 2-4.
