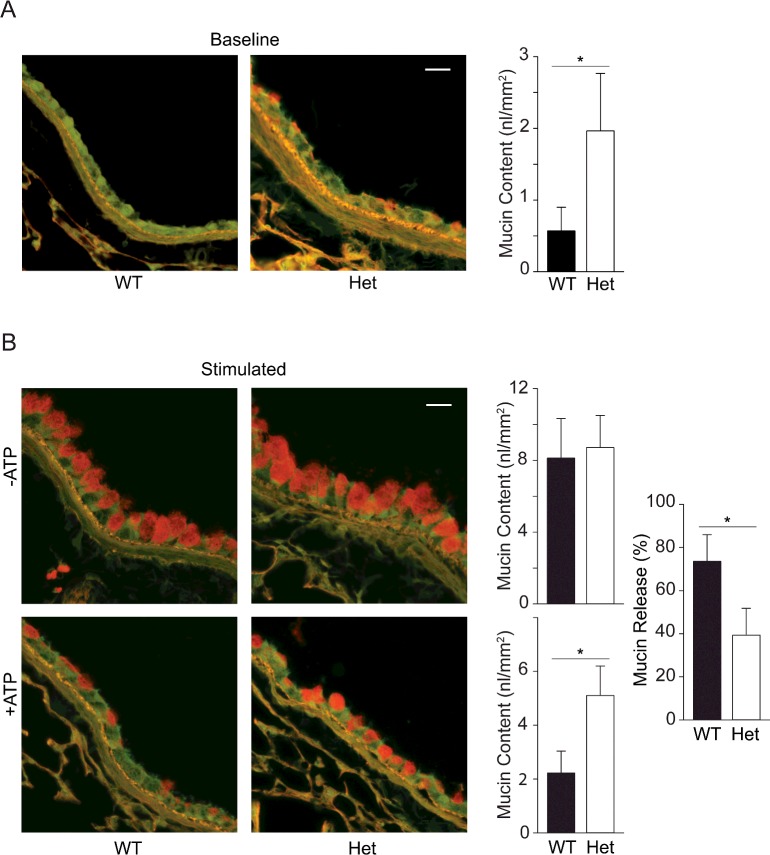
Figure 3. Steady state mucin secretory function in WT and SNAP23 Het mice.
(A) Baseline secretory function was examined by PAFS staining of bronchial airways of untreated WT and Het mice. Spontaneously accumulated intracellular mucin stains red and is quantified in the bar graph by analysis of images from two airway sections each from ≥ seven mice per group. *P<0.05. Scale bar=20 μm. (B) Stimulated secretory function was examined by PAFS staining of bronchial airways of mice with mucous metaplasia induced by ovalbumin sensitization and challenge, then not further treated (top row) or treated with an aerosol of 100 mM ATP to induce acute mucin secretion (bottom row). Intracellular mucin content is quantified in the adjacent bar graphs and the mucin content in mice treated with ATP as a percentage of that in untreated mice is shown at far right. Results are the weighted means ± S.E.M. of ≥ two separate experiments with a total of ≥ 12 mice per group, *P<0.05.

