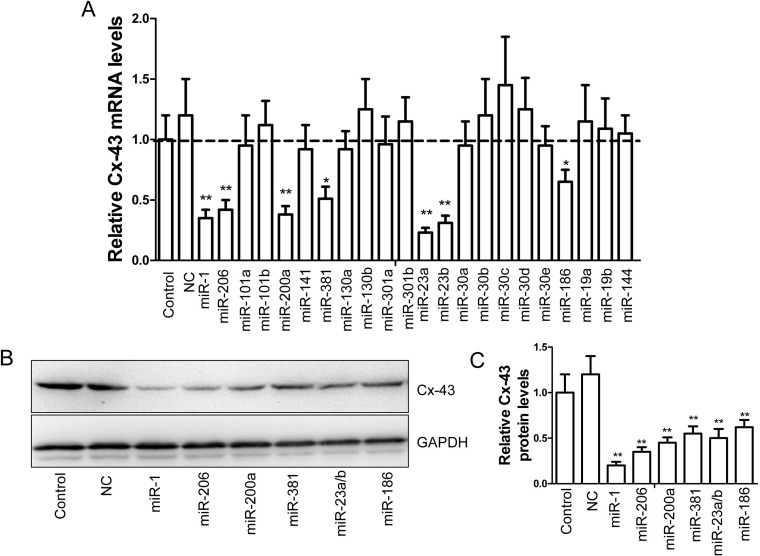
Figure 2. Identification of several miRs in regulating Cx43 expression.
(A). The mRNA levels of Cx43 in the MDA-MB-231 cells transfected with different miRs (100 nM), control miR (NC, 100 nM) or mock as control for 24 h (n=5, *P<0.05 and **P<0.01). (B) Immunoblotting assay of Cx43 protein in the MDA-MB-231 cells treated as described above in (A). (C). Statistic of the relative protein levels displayed in (B) (n=3, **P<0.01).

