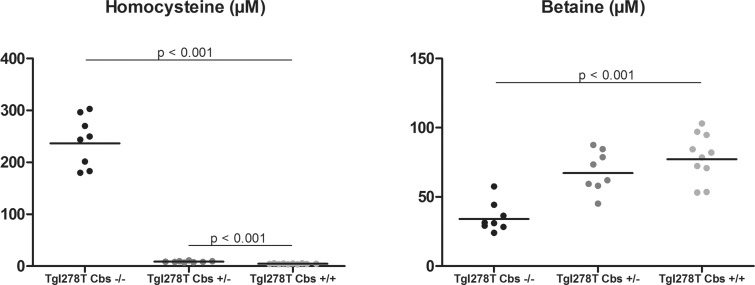
Figure 4. Plasma concentrations of tHcy and betaine in the mouse model of CBS deficiency.
Comparisons were made using the Mann–Whitney test between control mice Tg I278T Cbs+/+ and homozygous deficient mice Tg I278T Cbs+/− or heterozygous deficient mice Tg I278T Cbs−/−. Only the significant comparisons (P<0.05) using the Mann–Whitney test are represented in the figures.

