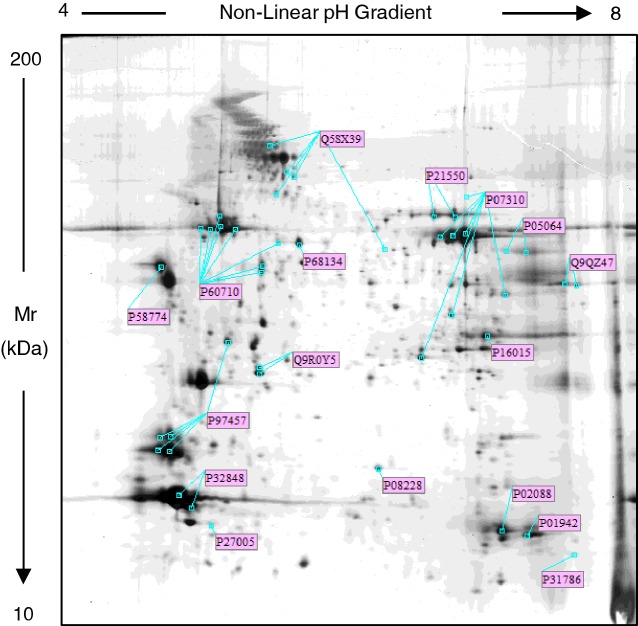
Figure 1. Representative silver stained proteomic maps of quadriceps from sedentary WT mouse.
Proteins (60 μg) were loaded on IPG strips (18 cm, 3.5–10 non-linear pH gradient). The second dimension was performed on a vertical linear-gradient slab gel (9%–16%). The pH-values of the first dimension gel system and molecular mass range (in kDa) of the second dimension are indicated on the top and on the left of the panels respectively. Spots labelled with the UniProt Accession Number were identified by MALDI-TOF/TOF-MS. Details of the identification are reported in Supplementary Table 1, supporting information.

