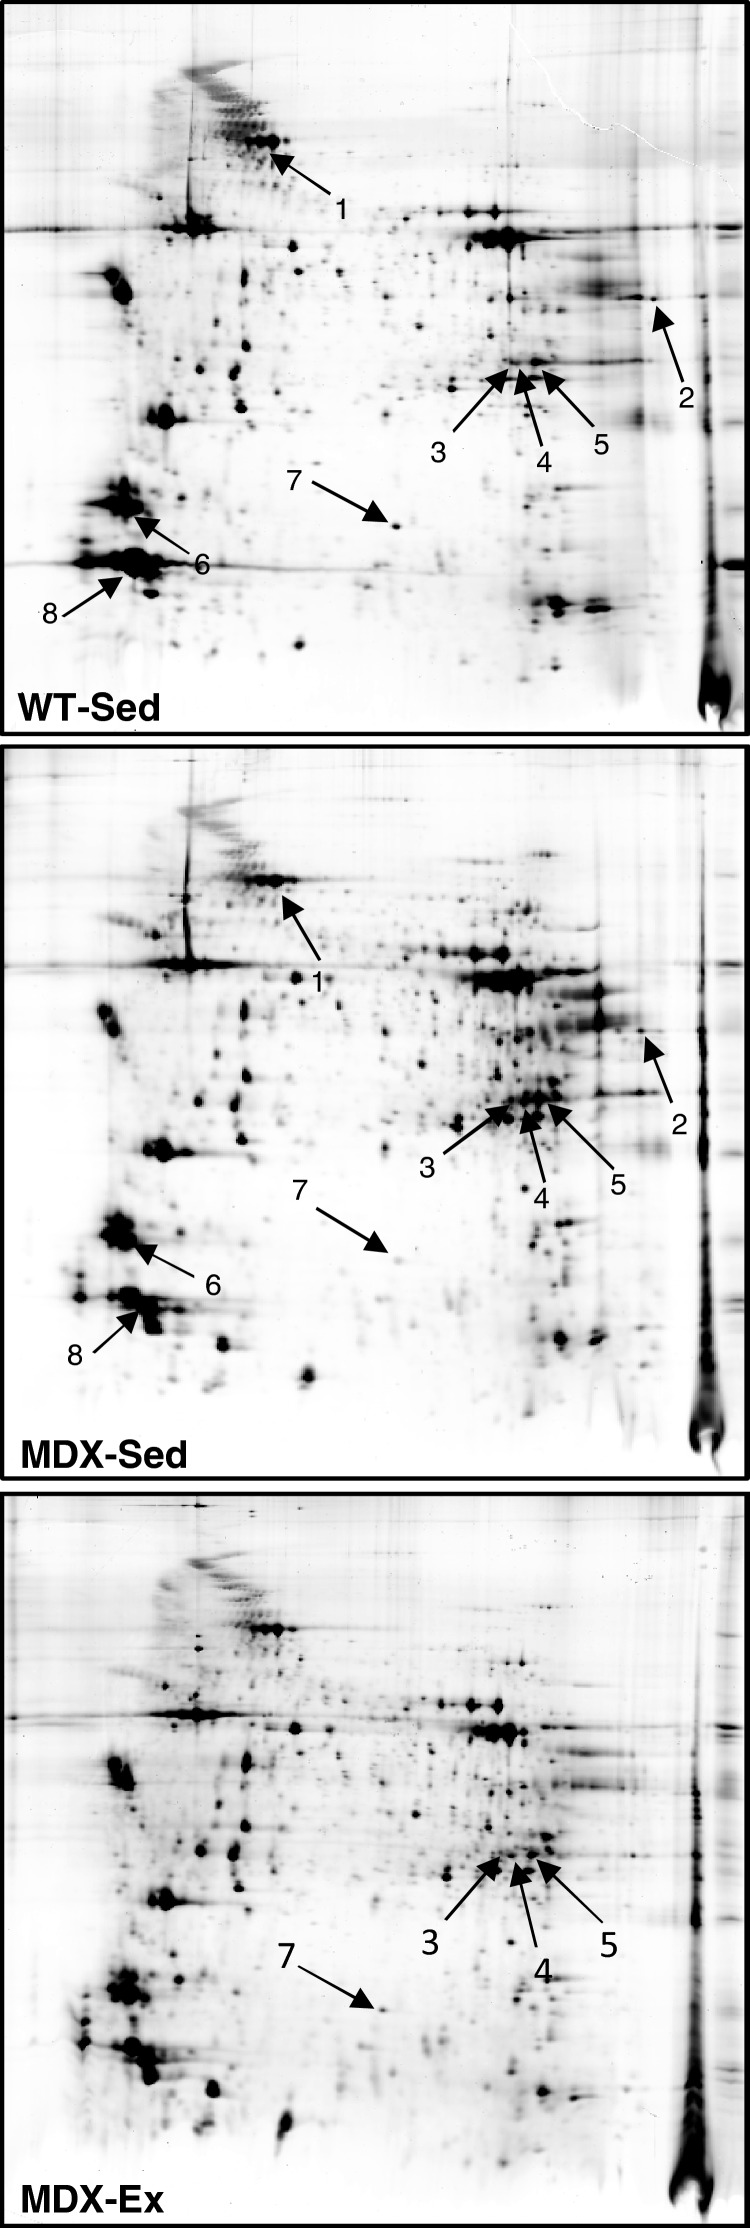
Figure 2. Detection of proteins differentially expressed in WT and MDX quadriceps.
Comparative analysis of protein profile of quadriceps from sedentary WT (WT-Sed) and sedentary mdx (MDX-Sed) mice highlighted eight protein spots showing a significant change in expression levels. These spots are marked by arrows and are numbered 1–8. The comparison of protein profile of quadriceps from MDX-Sed and exercised mdx (MDX-Ex) mice revealed that levels of spots 3, 4, 5 and 7 were affected by the low-intensity endurance exercise. Details of all these protein spots are reported in Table 1.

