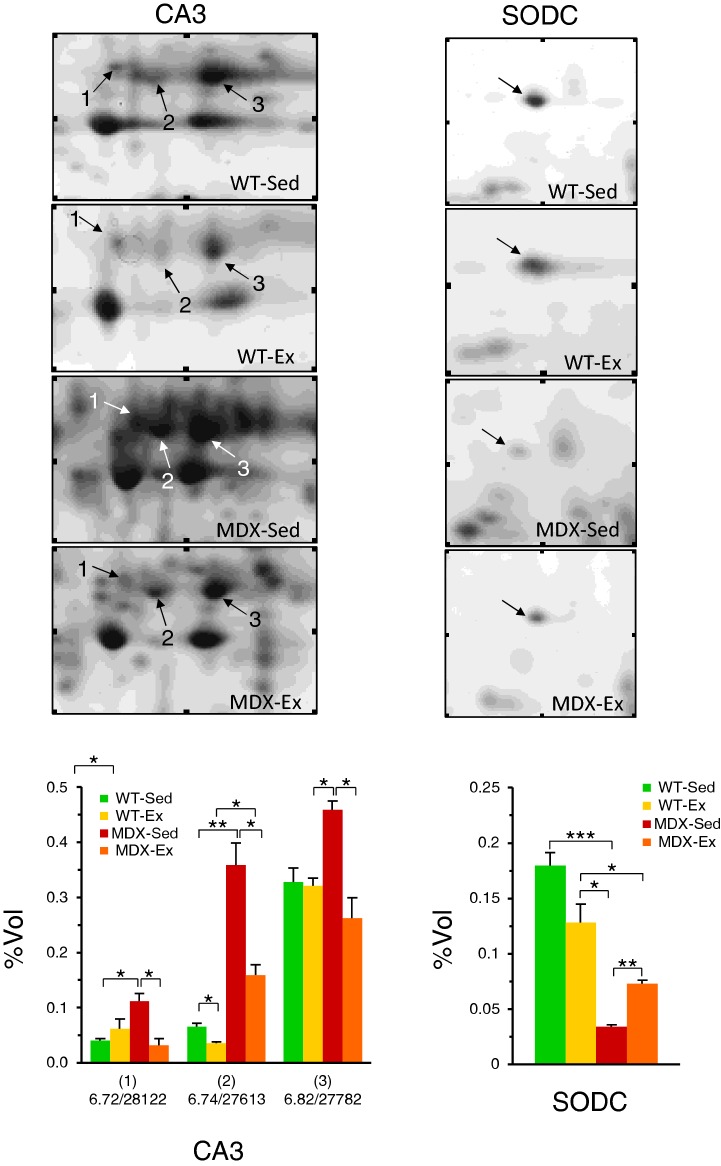
Figure 3. Expression pattern of CA3 isoforms and SODC in quadriceps.
Expanded view of 2D gels of quadriceps from sedentary WT (WT-Sed), exercised WT (WT-Ex), sedentary mdx (MDX-Sed) and exercised mdx (MDX-Ex) mice, in which the modulation of CA3 and SODC in MDX preparations can be observed. In the corresponding histogram, the %Vol values of each CA3 isoforms and SODC are reported. The CA3 isoforms are identified with pI-values and relative molecular masses: (1) pI 6.72/Mr 28122 Da; (2) pI 6.74/Mr 27613 Da and (3) pI 6.82/Mr 27782 Da. The values reported in the graphs are the mean of three independent experiments ± S.D. t test: *P<0.05; **P<0.01; ***P<0.001.

