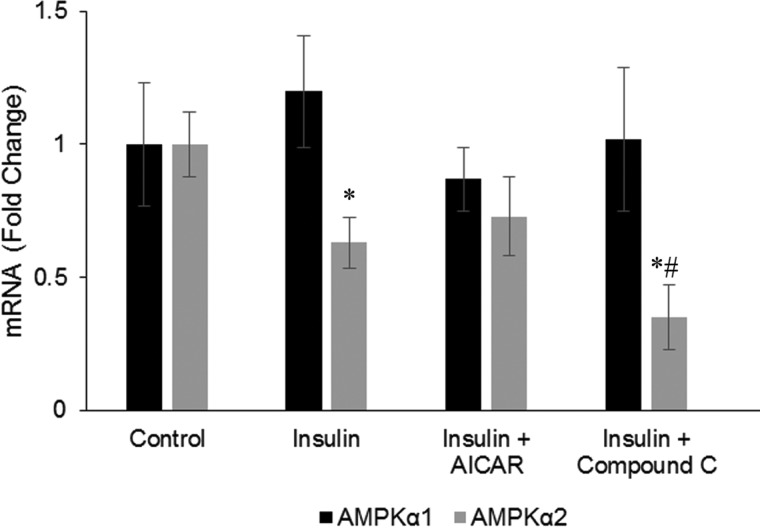
Figure 4. Effect of insulin on AMPK α1 and α2.
Effects of insulin on mRNA expression of AMPK α1 and α2. L6 myotubes were either untreated (control) or pre-treated with 1 mM AICAR or 20 μM CC or not with AICAR and CC for 1 h, followed by stimulation with 100 nM insulin for 24 h. Extracted RNA from L6 myotubes were assayed with qRT-PCR. Data were normalized to GAPDH and the values for the control group set at 1.0. Values are expressed as means ± S.D. (n=3). *P<0.05 compared with control. #P<0.05 compared with insulin only group.

