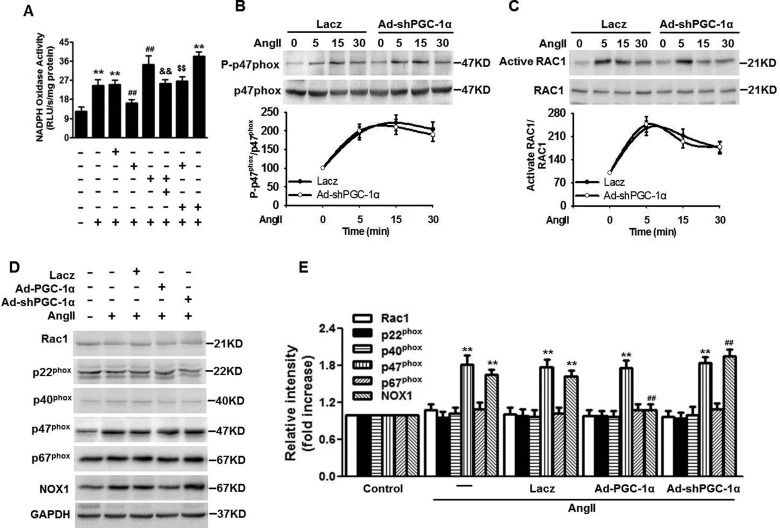
Figure 4. Overexpression of PGC-1α inhibits AngII-induced NOX1 expression.
(A) Quantitation analysis of NADPH oxidase activity measured in the presence of lucigenin (5 mmol/l) followed by treating with or without NADPH (100 μmol/l). (B and C) VSMCs were treated with LacZ or Ad-PGC-1α for 48 h, and then AngII at 0.1 μmol/l was added for the indicated times. Phospho-p47phox and total p47phox (B), and active Rac1 and total Rac1 (C) were detected by Western blotting. Molecular masses are indicated in kDa. (D) Western blot analysis of Rac1, p22phox, p40phox, p67phox and NOX1 in the lysates of VSMCs. Cells were infected with LacZ, Ad-shPGC-1α or Ad-PGC-1α for 48 h before incubation of AngII for another 48 h. GAPDH was used as loading control. Molecular masses are indicated in kDa. (E) Densitometric analysis of Rac1, p22phox, p40phox, p67phox and NOX1 was performed. **P<0.01 compared with control; ##P<0.01 compared with AngII; &&P<0.01 compared with Ad-shPGC-1α+AngII; $$P<0.01 compared with Ad-PGC-1α+AngII (n=6).

