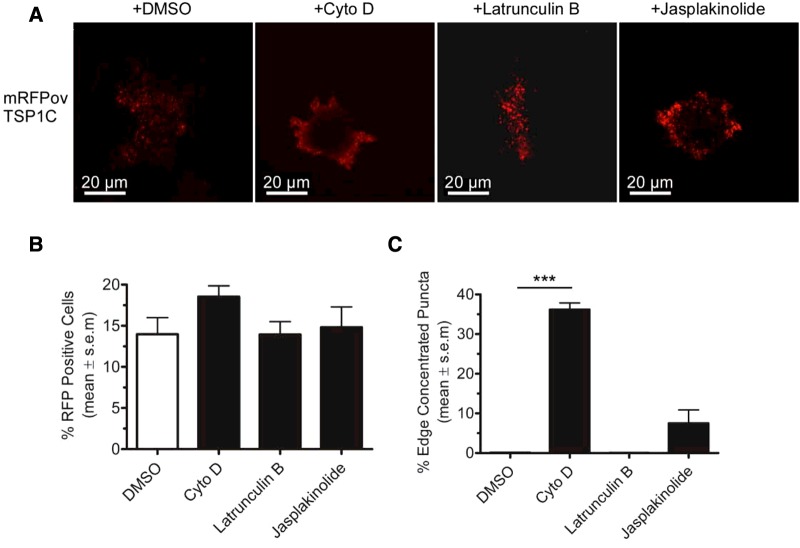
Figure 3. Effect of actin-perturbing inhibitors on ECM patterning of mRFPovTSP1C.
(A) Representative fluorescence images of ECM deposition patterns of mRFPovTSP1C after treatment of cells with vehicle (DMSO), 0.5 μM cytochalasin D, 0.67 μM jasplakinolide or 0.5 μM latrunculin B for 18 h. (B) Quantification of mRFPovTSP1C-expressing cells under the different experimental conditions. (C) Quantification of edge-concentrated ECM puncta under the different experimental conditions. (B and C) Columns represent the mean and bars indicate S.E.M. from three independent experiments. ***P<0.001.

