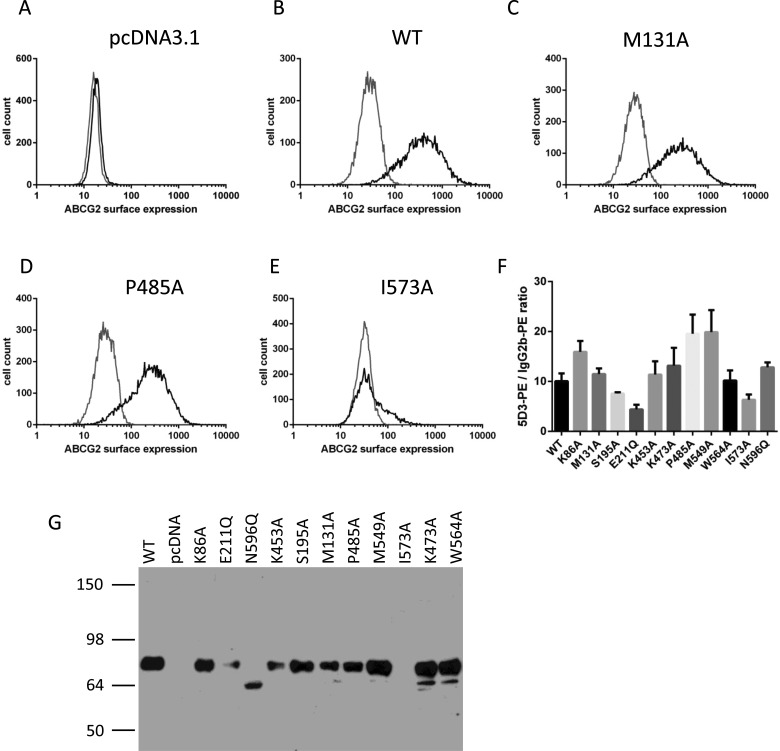
Figure 2. Transient expression of His12–ABCG2 and isoforms in HEK293T cells.
Flow cytometry analysis of cell surface expression 40 h post-transfection (A–E). Black lines represent distributions of cellular fluorescence following labelling with PE-conjugated anti-ABCG2 antibody 5D3. Grey lines represent isotype control labelling. (A–E) Representative data of the empty vector, WT or named isoforms. The relative surface expression (F) was quantified as the ratio of the mean fluorescence values in the presence of 5D3 to the mean fluorescence value in the presence of isotype control antibodies. Mean (± S.E.M.) is shown for at least four independent transfections. (G) Western blotting of total ABCG2 expression was determined by resolving 30 μg of whole cell lysate on 10% w/v acrylamide gels and probing with BXP-21 antibody. A representative image of at least four independent experiments is shown.

