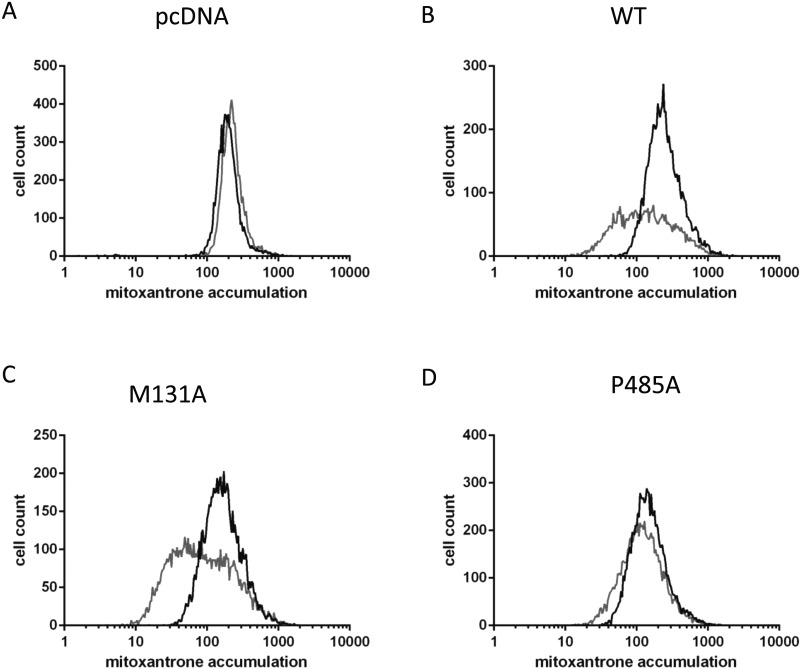
Figure 5. Functional analysis of His12–ABCG2 isoforms.
Functional analysis was undertaken by flow cytometry 40 h post transfection determining the cellular accumulation of MX in the absence (grey line) or presence (black line) of FTC. Data are representative of at least four independent transfections and reflect negative control data (empty vector, A), positive control data (WT ABCG2 expression, B), a mutant with normal MX transport function (M131A, C) and a mutant with abrogated function but normal surface expression (P485A, D).

