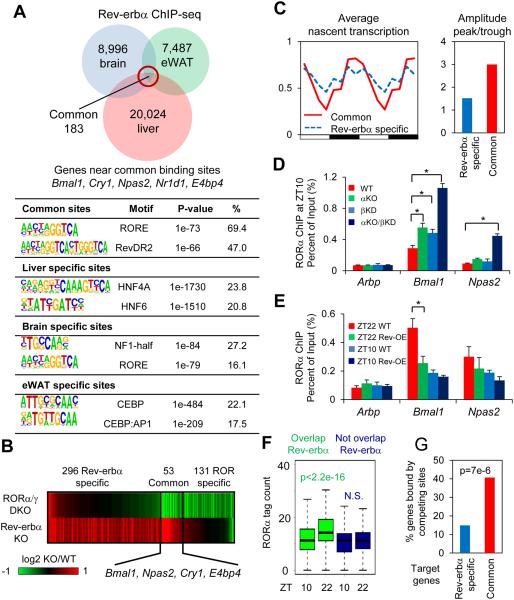
Figure 1. Rev-erbα represses clock genes by competing with RORα at its cognate sites.
(A) Overlap of Rev-erbα cistromes in liver (9), brain and epididymal adipose tissue (eWAT). Most significantly enriched known motifs (abundance>10%) in common and tissue specific cistromes are shown. (B) Heat map showing expression fold changes of genes deactivated by RORα/γ double KO (DKO/WT< −1.3, p<0.01) and derepressed by Rev-erbα KO (αKO/WT>1.3, p<0.01). (C) Mean relative GRO-seq transcription (left) throughout 24-hour light dark cycle, as well as oscillation amplitudes (right) of RORs/Rev-erbα common targets (red) and Rev-erbα specific targets (blue). Time points were duplicated for clearer visualization. (D) RORα binding at clock and control genes promoters at ZT10, in wild type (WT), Rev-erbα KO (αKO), Rev-erbβ knockdown (βKD), and αKO/βKD mice liver, interrogated by ChIP-PCR. Data are expressed as mean± SEM (* Student’s t-test, p<0.05, n=4). (E) RORα binding at clock and control genes promoters at ZT10 or ZT22 in Rev-erbα overexpression (OE) mouse liver, interrogated by ChIP-PCR. Data are expressed as mean± SEM (* Student’s t-test, p<0.05, n=6 or 7). (F) Circadian binding of RORα at sites overlapped or not overlapped with Rev-erbα cistrome (N.S. Student’s t-test, p>0.05). (G) Percentage of common or Rev-erbα specific target genes containing high confidence oscillating RORα binding sites (ZT22>2 reads per million (rpm), ZT22/ZT10>1.5) within 50kb of TSSs (P value from hypergeometric test).

