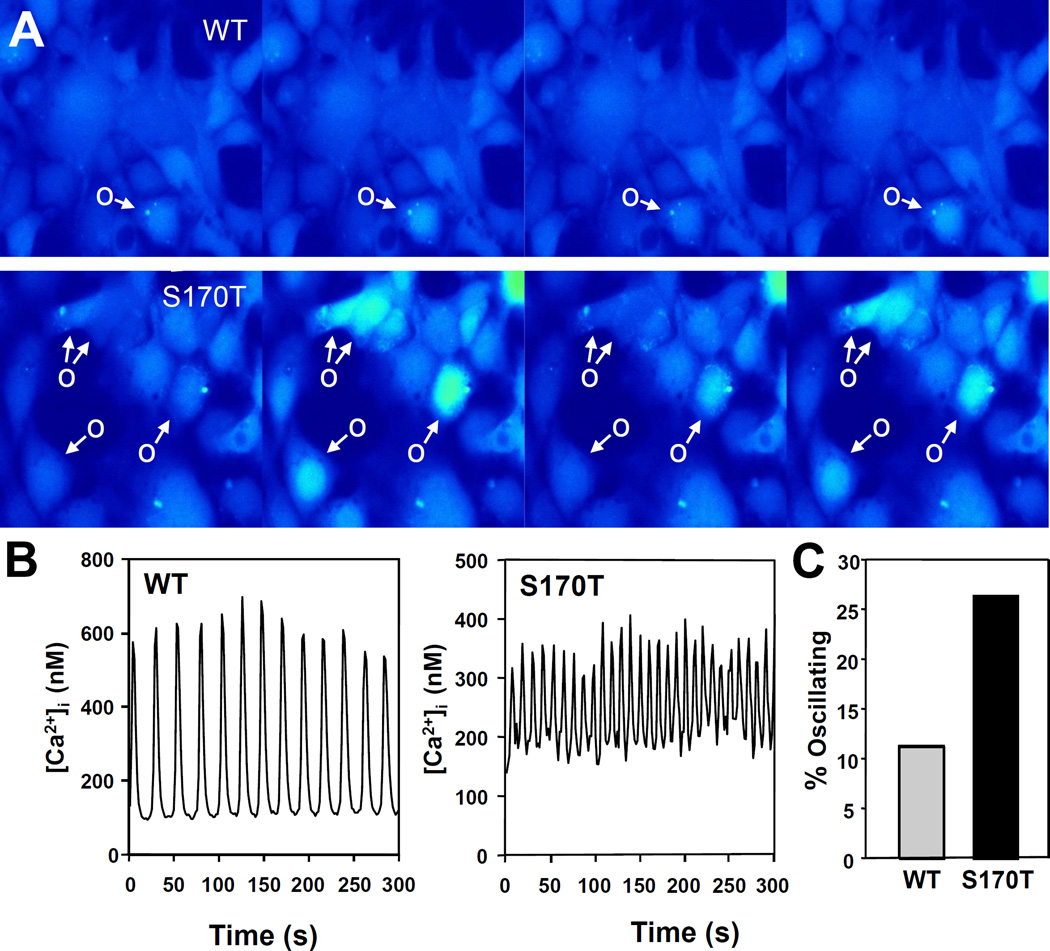
Figure 2.
Spontaneous [Ca2+]i oscillations of HEK-293 cells transfected with wild type CaSR (WT) or CaSRS170T (S170T) and incubated in medium containing 1.5 mM [Ca2+]e. A. Pseudo-colored images of clusters of cells showing changes in [Ca2+]i with time. Shown is one cycle of rest to peak response. Spontaneously oscillating cells (O) are marked with an arrow. B. Typical traces of [Ca2+]i as a function of time (s) for a single HEK-293 cell transfected with the wild type CaSR or a single HEK-293 cells transfected with CaSRS170T. C. Percentage of spontaneously oscillating HEK-293 cells from a total of 544 transfected with the wild type CaSR and from 170 cells transfected with CaSRS170T.

