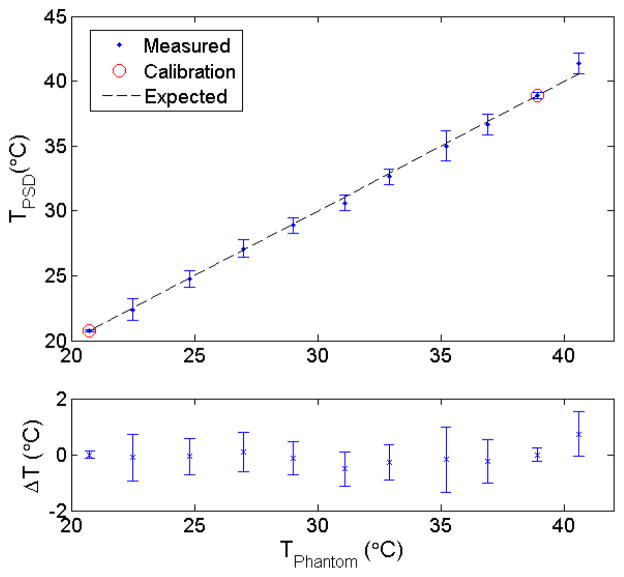
Figure 5.
Variation in temperature measured using the plastic scintillation detector compared with the expected values (top panel). Average and standard deviation of the calculated values are shown. Calibration of the plastic scintillation detector for temperature measurement was performed using the contribution factors measured at 20.75°C and 38.9°C. The differences between measured and expected values (ΔT) are shown in the bottom panel.

