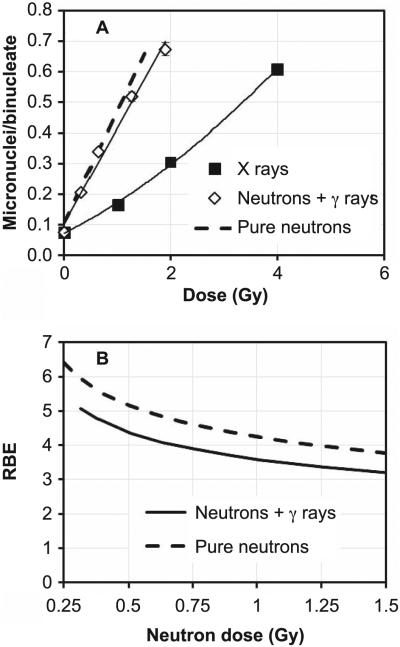
FIG. 4.
Panel A: Micronucleus frequency in human peripheral blood lymphocytes exposed ex vivo to neutrons or X rays. The data show mean micronuclei per binucleate cell yields from three healthy volunteers. Error bars show ±SEM. The mixed field yields plotted vs. total dose (neutrons + gamma rays). The solid lines indicate a linear (neutrons) or linear-quadratic (X rays) fit. The dashed line indicates the estimated response to a pure neutron dose. Panel B: RBE values for the mixed field and for the pure neutrons, calculated from panel A (see text for details).

