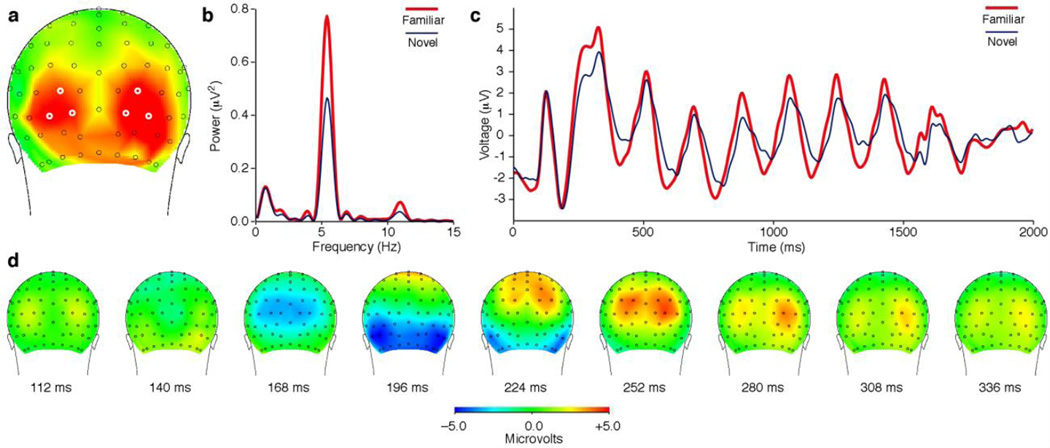
Figure 6. In human subjects, rapidly alternating familiar images elicit stronger periodic scalp responses than rapidly alternating novel images.
(a) Saturated red indicates scalp locations at which, in the group data, the difference in strength achieved significance at a level of p < 0.001 with Bonferroni correction for multiple comparisons. (b) Frequency domain analysis. Power at the driving frequency of 5.45 Hz was greater for familiar (red) than for novel (blue) image strings. (c) Time domain analysis. The peak to trough excursion was greater on average for familiar (red) than for novel (blue) strings. Traces in panels (b–c) represent measures obtained by averaging across the six electrodes circled in white in (a). (d) The scalp response elicited by an image which appeared at time zero and remained visible for 600 ms. The dorsal-to-ventral progress of the leading negative component (blue) presumably reflects the spread of activation from primary visual cortex to visual areas of higher order. The scalp region at which familiar image strings elicited significantly stronger driven periodic activity, visible as red in (a), was displaced laterally and ventrally from the zone of earliest negativity, visible as blue at 168 ms in (d).

