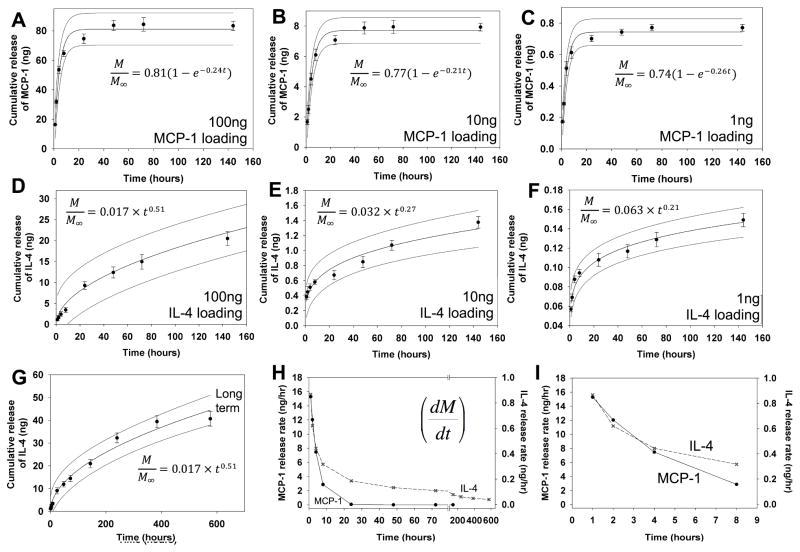
Figure 2. MCP-1 and IL-4 release from hydrogels.
MCP-1 was loaded into hydrogels (A) 100 ng, (B) 10 ng and (C) 1 ng. Cumulative release curves indicate 80% of loaded cytokine is released over the first 48 hr. IL-4 was loaded into hydrogels at a concentration of (D) 100 ng, (E) 10 ng and (F) 1 ng. Cumulative release curves indicate about 15–20% of loaded cytokine is released over the first 6 days, with up to 40% release after 16 days (G). Release rate was plotted as the first derivative of cumulative release rate (H), with the first 8 hours shown in detail (I). Release was modeled, best fit curve and with 95% CI bands for A–G are shown.

