Figure 1.
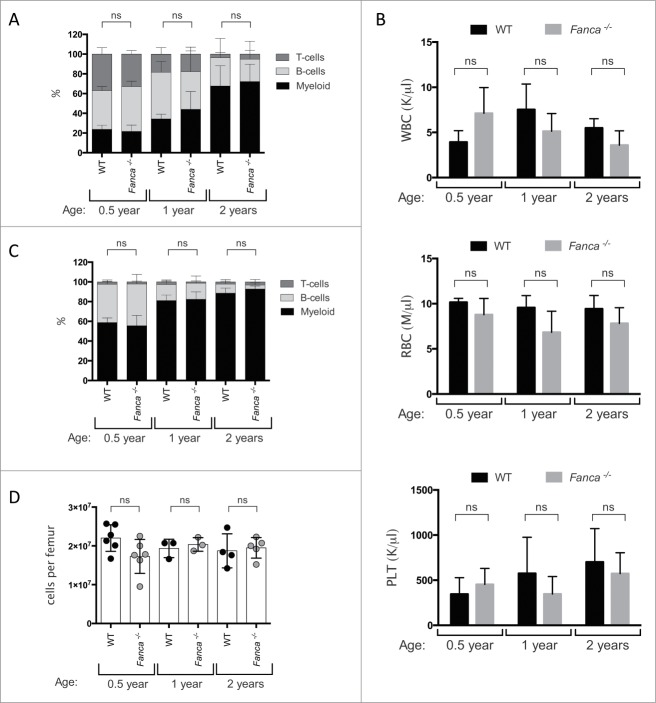
Analysis of mature blood cells in the peripheral blood and bone marrow of young and aged WT and Fanca−/− mice. (A and B) Peripheral blood cell analysis of WT (black) and Fanca−/− (gray) mice at 0.5 year, 1 and 2 y showing A) the percentage of myeloid (Gr-1+, Mac-1+), T-cells (CD3e+) and B-cells (B220+); B) the white blood cell (WBC), red blood cell (RBC) and platelet (PLT) count. (C and D) Analysis of BM of 0.5 year, 1 and 2 y old WT (black) and Fanca−/− (gray) mice showing (C) the percentage of myeloid (Gr-1+, Mac-1+), T-cells (CD3e+) and B-cells (B220+); (D) the absolute number of BM cells per femur. Mean ± standard deviation (s.d.) is shown for n = 3 −6 mice per group. Not significant (ns) = P > 0.05, unpaired t-test,

