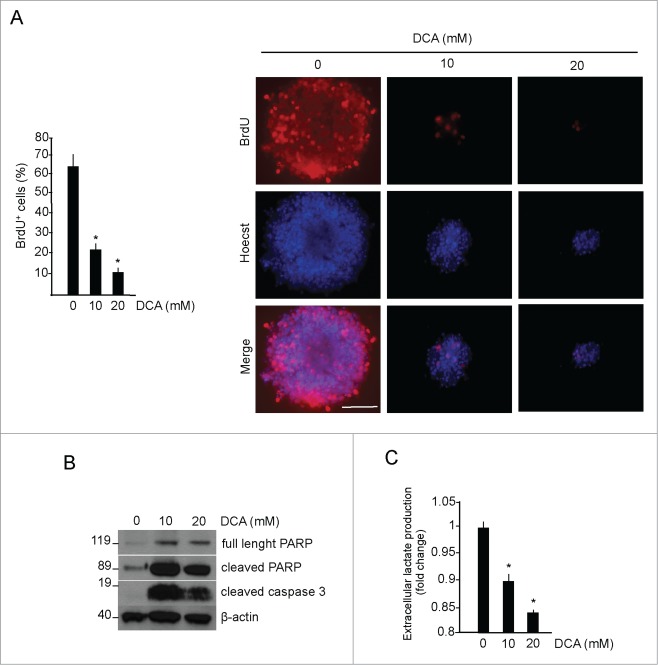
Figure 4.
Glycolytic phenotype promotes proliferation and survival in medulloblastoma neurospheres. (A) DCA treatment (48 hours) of medulloblastoma neurospheres proliferation, measured by BrdU incorporation (red). Cells were counterstained by nuclear fluorescent stain Hoecst33342 (blue). Scale bar = 100 μm. *DCA versus control, P < 0.01; n = 4 (B) Apoptotic markers (PARP and Caspase 3 activation) and β-actin levels (as loading control) were detected by Western blotting, n = 4. (C) L-lactate levels in MB neurospheres, treated as above. Values are expressed as fold change, relative to untreated cells. *P < 0.01; n = 4.

