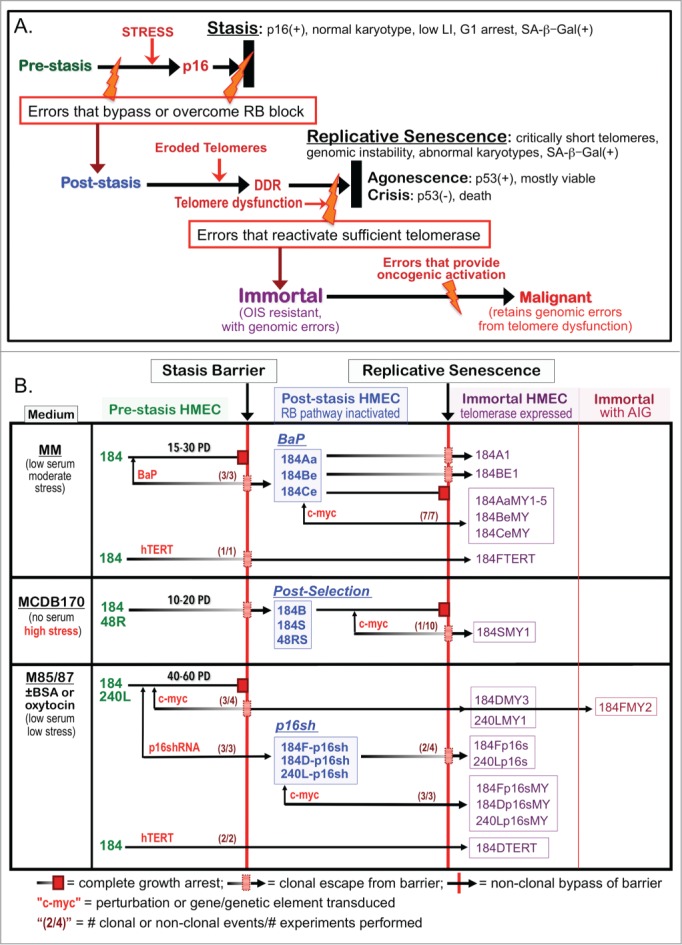
Figure 1.

HMEC model system. (A) Schematic representation of cultured HMEC tumor-suppressive senescence barriers. Thick black bars represent the proliferation barriers of stasis and replicative senescence. Orange bolts represent genomic and/or epigenomic errors allowing these barriers to be bypassed or overcome. Red arrows indicate crucial changes occurring prior to a barrier. (B) Derivation of isogenic HMEC from specimens 184, 48R, and 240L at different stages of transformation ranging from normal pre-stasis to malignant. Cells were grown in media varying in stress induction, measured by increased p16 expression (left column), and exposed to various oncogenic agents (red). The distinct types of post-stasis HMEC are shown in the middle column; nomenclature for types is based on agent used for immortalization (e.g., BaP; p16sh) or historical naming (e.g., post-selection 19). Transduced finite cultures are indicated by specimen number and batch (e.g., 184F, 184D, 184B) followed by a “-“ and the agent transduced (e.g., -p16sh); the BaP post-stasis nomenclature is based on original publications, and includes specimen number and batch (e.g., 184A, 184B, 184C) 7, 16. New immortalized lines described in this paper are outlined in the right columns; nomenclature is based on the oncogenic agents employed (e.g., p16s for p16sh, MY for c-MYC, TERT). Numbers in parentheses before the barriers indicate how many time there was clonal or non-clonal escape from that barrier out of how many experiments performed (e.g., c-MYC-transduced pre-stasis HMEC were cultured to stasis 4 times; in 3 experiments there was clonal escape from stasis leading to 3 clonally immortalized lines).
