Abstract
Hybrid denoising models based on combining empirical mode decomposition (EMD) and discrete wavelet transform (DWT) were found to be effective in removing additive Gaussian noise from electrocardiogram (ECG) signals. Recently, variational mode decomposition (VMD) has been proposed as a multiresolution technique that overcomes some of the limits of the EMD. Two ECG denoising approaches are compared. The first is based on denoising in the EMD domain by DWT thresholding, whereas the second is based on noise reduction in the VMD domain by DWT thresholding. Using signal-to-noise ratio and mean of squared errors as performance measures, simulation results show that the VMD-DWT approach outperforms the conventional EMD–DWT. In addition, a non-local means approach used as a reference technique provides better results than the VMD-DWT approach.
Keywords: discrete wavelet transforms, medical signal processing, electroencephalography, AWGN, signal denoising
Keywords: electrocardiogram signal denoising, wavelet thresholding, in empirical mode decomposition domains, variational mode decomposition domains, hybrid denoising models, discrete wavelet transform, additive Gaussian noise, ECG signals, DWT thresholding
1. Introduction
The electrocardiogram (ECG) signal is widely used to measure and to diagnose cardiac activity and arrhythmia in clinical environments. Thus, it is an important tool for the diagnosis of cardiac abnormalities to monitor urgent treatments. However, ECG signal can be corrupted by unwanted interference such as power line interference, electrode contact noise, motion artefacts, muscle contraction, baseline drift, ECG signal amplitude modulation with respiration, instrumentation noise and electrosurgical noise [1].
Several approaches have been proposed in the literature to denoise ECG signal with the purpose of obtaining a denoised ECG that facilitates easy and accurate interpretation. The proposed approaches include filter banks [2], independent component analysis [3, 4], adaptive filtering [5, 6], discrete wavelet transform (DWT) [7–9] and empirical mode decomposition (EMD) [10–13]. When compared with other approaches, the denoising methods based on EMD and wavelet are found to be more effective in reducing noise from the ECG signals [12]. Indeed, a hybrid EMD–DWT approach has been proposed in the literature [11, 12, 14] to achieve accurate denoising performance for the ECG signal. For instance, the DWT is a suitable tool for isolating transient (non-stationary) changes in a time series by combining the time-domain and frequency-domain analysis [15]. In addition, the advantage of the DWT is that the windows vary, and it has an infinite set of possible basis functions [13]. Particularly, the basic wavelet transform starts with a basis function, the mother wavelet, and decomposes a signal into components of different time and frequency scales; longer time intervals are used to obtain low-frequency information and shorter intervals are used to obtain high-frequency information. Besides, the EMD [16] is an adaptive and data-driven technique used for processing non-linear and non-stationary signals in addition to stationary signals. The EMD decomposes a given signal into a finite sum of components plus a residue. The components are called intrinsic mode functions (IMF) and are local and auto-adaptive. Low order IMF represent fast oscillation or high-frequency modes, and high order IMF represent slow oscillation (low-frequency) modes. As a result, the EMD is well suited for biomedical signal analysis [13]. Owing to the effectiveness of the hybrid EMD–DWT model, it was also successfully applied to other signal processing problems including denoising of electrostatic signals [17], ultrasonic images [18] and hyperspectral images [19].
However, the EMD algorithm suffers from a lack of exact mathematical model, interpolation choice, and sensitivity to both noise and sampling [20]. Very recently, as an alternative to the EMD algorithm, Dragomiretskiy and Zosso [20] proposed an entirely non-recursive variational mode decomposition (VMD) model, where the modes are extracted concurrently. In particular, the VMD model searches for a number of modes and their respective centre frequencies, such that the band-limited modes reproduce the input signal exactly or in least-squares sense [20]. Using simulated harmonic functions, Dragomiretskiy and Zosso [20] found that the VMD as a denoising approach outperforms the EMD.
This Letter is therefore aimed to compare two hybrid systems for the purpose of ECG denoising; namely the conventional EMD–DWT and the VMD-DWT model. Indeed, we investigate whether the VMD can outperform the EMD in denoising the ECG signal. In addition, we also evaluate the performance of these methods against the non-local means (NLM) approach [21], which was recently found to be effective in denoising ECG signals.
In this Letter, three approaches are investigated in denoising the original ECG signal, which is corrupted with additive Gaussian noise. In the first approach, the EMD is applied to the noisy ECG signal for decomposition purposes to obtain IMF. Then, the DWT-based thresholding technique is applied to each obtained IMF. Indeed, thresholding the wavelet coefficients is the most straightforward way of distinguishing information from noise in the wavelet domain [22]. In this Letter, the optimal threshold value is determined by minimising Stein's unbiased risk estimator (SURE) [23] called SureShrink and was proposed by Donoho and Johnstone [24]. The SURE was chosen because it is more accurate as more data are available [22]. Finally, the denoisied ECG signal is reconstructed by summing up the denoised IMF. In the second approach, the VMD is applied to the noisy ECG signal for decomposition purpose to obtain variational modes. Similar to the EMD–DWT denoising approach, the DWT-based thresholding technique is applied to each obtained variational mode. Then, the denoised ECG signal is reconstructed by summing up the denoised variational modes. In the third approach; which is also used for comparison purposes; the non-local means approach is applied to the noisy ECG signal to obtain the denoised one. For all the experiments, the well known signal-to-noise ratio (SNR) and mean of squared errors (MSE) are adopted as the main performance measures. In summary, our work contributes to previous works found in the literature [11, 12, 14, 25] by comparing the conventional hybrid EMD–DWT with the new VMD-DWT approach and adopting the NLM technique as a reference model.
The remainder of this Letter is organised as follows; Section 2 presents the methods, Section 3 applies these methods to ECG signals and presents the experimental results, and finally, conclusions are provided in Section 4.
2. Methods
The EMD [16] decomposes a signal into a sum of functions. Each of these functions has the same number of zero crossings and extrema, and is symmetric with respect to its local mean. These functions are called IMF and are found at each scale going from fine to coarse by an iterative procedure called sifting algorithm. Finally, the signal s(t) can be expressed as follows
| (1) |
where N is the number of IMF, which are nearly orthogonal to each other, and all have nearly zero means; and rN(t) is the final residue, which is the low-frequency trend of the signal s(t). Usually, the standard deviation (SD) computed from two consecutive sifting results is used as criteria to stop the sifting process by limiting the SD size as follows
| (2) |
where k is the index of the kth difference between the signal s(t) and the envelope mean e(t). The term ε is a pre-determined stopping value.
The purpose of the VMD [20] is to decompose an input signal into k discrete number of sub-signals (modes), where each mode has limited bandwidth in the spectral domain [20]. Thus, each mode k is required to be mostly compact around a centre pulsation ωk determined along with the decomposition [20]. The VMD algorithm to assess the bandwidth of a one-dimensional signal is as follows [20]: (i) for each mode uk, compute the associated analytic signal by means of the Hilbert transform to obtain a unilateral frequency spectrum, (ii) for each mode, shift the mode's frequency spectrum to baseband by mixing with an exponential tuned to the respective estimated centre frequency and (iii) estimate the bandwidth through Gaussian smoothness of the demodulated signal, for example, the squared L2-norm of the gradient. Then, the constrained variational problem is given by [20]
| (3) |
Subject to
| (4) |
where f is the signal, u is its mode, ω is the frequency, δ is the Dirac distribution, t is the time script, k is the number of modes and * denotes convolution. The mode u with high-order k represents the low-frequency components.
In general, wavelet thresholding involves three steps. First, the signal (e.g. the ECG signal) is processed with a DWT [26] for decomposition purposes. As a result, the signal is decomposed into low–low, low–high, high–low and high–high sub-bands. Then, a non-linear thresholding is performed on each DWT sub-band coefficient. In particular, if the DWT coefficient is smaller than the threshold it is set to zero. Otherwise, it is kept or modified. Finally, an inverse DWT is performed to recover the denoised signal. Donoho and Johnstone [24] proposed an approach to determine the optimal threshold value based on the minimisation of SURE denoted by Rs(t), which is given by
| (5) |
where g is a function in ℜ, y = [y0, y1,…, yM − 1] and
| (6) |
Using the standard soft-thresholding function, the selected threshold ts is given by
| (7) |
The NLM denoising approach estimates the denoised signal snlm(t) for a given sample s as a sum of values at other points t that are within some search neighbourhood N(s) as follows [21]
| (8) |
where z(s) and weights w(s, t) are given by [22, 27]
| (9) |
| (10) |
where λ is a bandwidth parameter, Δ is a local patch of samples surrounding s containing LΔ samples, d2 denotes the summed, squared point-by-point difference between samples in the patches centred on s and t [21]. Finally, each patch in (10) is averaged with itself with weight w(s, s) = 1 [21], and a centre patch correction is applied to achieve a smoother result. It is given by [21]
| (11) |
Finally, to evaluate the effectiveness of each ECG signal denoising approach, the SNR, which is expressed in decibel and the MSE are computed. The SNR and MSE are given by
| (12) |
| (13) |
where x[n] denotes the original ECG signal, y[n] is the noisy ECG signal, xr[n] is the obtained denoised ECG signal and N is the ECG signal length.
3. Experimental results
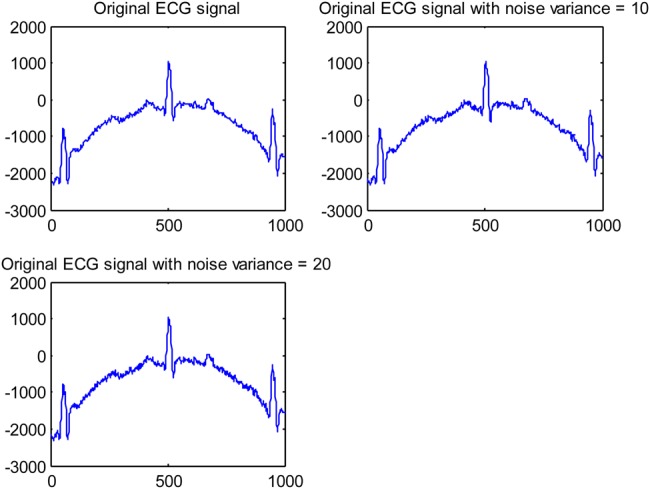
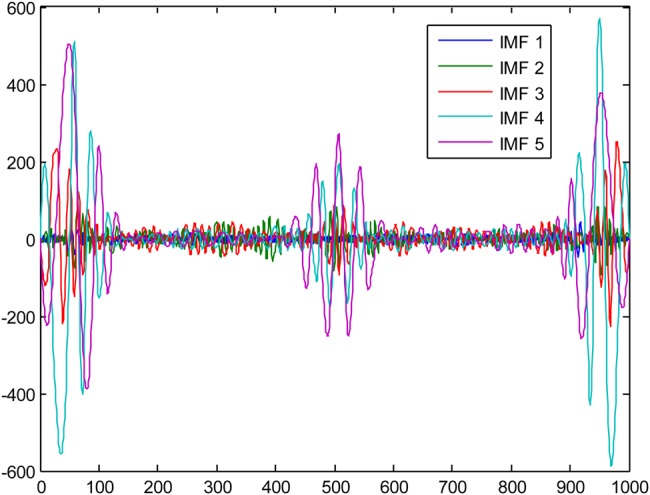
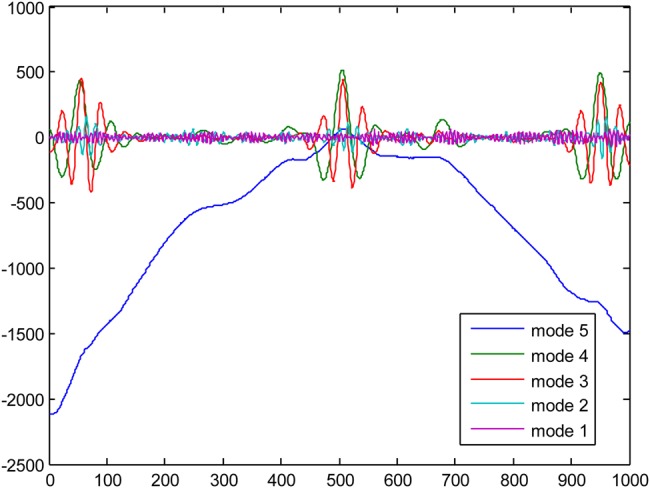
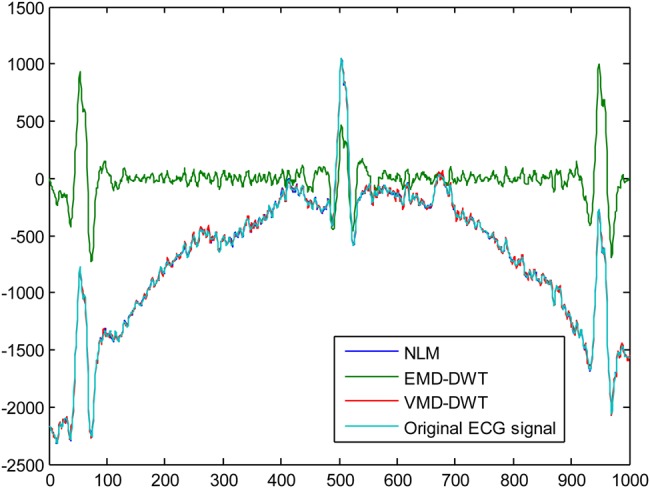
For our experiments, five different ECG signals were randomly selected from PhysioNet MIT-BIH Arrythmia Database [27] to evaluate the efficacy of the EMD–DWT, VMD-DWT and NML denoising approach. For each ECG signal, 1000 samples were chosen to conduct our study. The original ECG signal is added with Gaussian noise of variance 10 and 20 to obtain two noisy ECG signals. For the DWT thresholding-based approach, we considered the Daubechies-4 (DB4) and Symlet-4 (Sym4) as mother wavelets, and second and third level of decomposition [28]. For the simplicity of computations, the level of decomposition is set to five for both EMD and VMD. Fig. 1 illustrates an example of the original ECG signal and the same signal corrupted with a Gaussian noise with variance 10, and 20, respectively. Figs. 2 and 3 illustrate, respectively, some of the IMF and variational modes obtained by EMD and VMD of the original ECG signal shown in Fig. 1 corrupted with noise variance 10. Finally, Figs. 4 and 5 show the obtained denoised ECG signals when using DB4 and Sym4 wavelets, respectively.
Figure 1.
Example of original ECG signal and added Gaussian noise
Figure 2.
EMD results of the original ECG signal corrupted with noise variance set to 10
Figure 3.
VMD results of the original ECG signal corrupted with noise variance set to 10
Figure 4.
Denoising results using the DB4 wavelet of the original ECG signal corrupted with noise variance = 10
Figure 5.
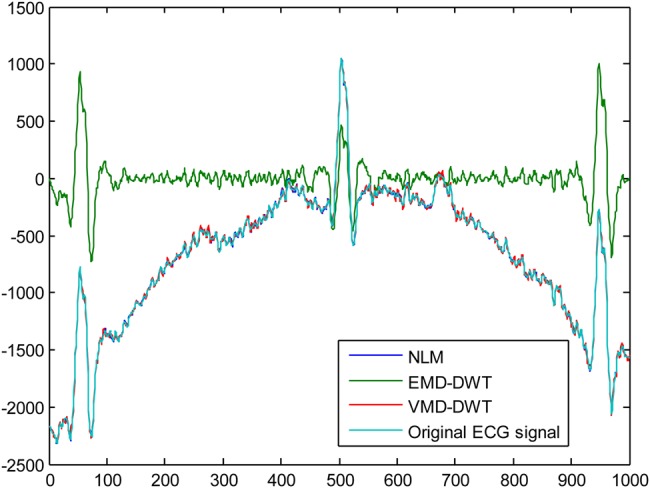
Denoising results using the Sym4 wavelet of the original ECG signal corrupted with noise variance = 10
Tables 1–20 provide the SNR and MSE values obtained by each approach. For better denoising performance, the SNR should be high, while the MSE should be low. The SNR values obtained with the NLM technique are given in Table 21. According to SNR and MSE values provided in Tables 1–20, the VMD-DWT outperforms the standard EMD–DWT model by using both DB4 and Sym4 wavelets in denoising the original ECG signal when it is affected with Gaussian noise of variance 10 and 20. In addition, these findings are confirmed at all DWT decomposition levels. Compared to non-local means denoising approach, the SNR and MSE values obtained and presented in Table 21 show that the NLM technique performs better than the EMD–DWT and VMD-DWT approaches for both types of noise levels. However, it is worth noting that, according to Figs. 4 and 5, the NLM and VMD-DWT achieved comparable performances.
Table 2.
SNR and MSE values depending on the DWT decomposition level using the Sym4 wavelet: first ECG signal with noise variance 10
| Level 1 | Level 2 | Level 3 | ||
|---|---|---|---|---|
| EMD-Sym4 | SNR | 3.2753 | 3.2753 | 3.2753 |
| EMD-Sym4 | MSE | 30828.5871 | 30828.2766 | 30828.1463 |
| VMD-Sym4 | SNR | 23.5495 | 23.5598 | 23.5501 |
| VMD-Sym4 | MSE | 289.4219 | 288.7344 | 289.3812 |
Table 3.
SNR and MSE values depending on the DWT decomposition level using the DB4 wavelet: first ECG signal with noise variance 20
| Level 1 | Level 2 | Level 3 | ||
|---|---|---|---|---|
| EMD-DB4 | SNR | 2.8907 | 2.8906 | 2.8906 |
| EMD-DB4 | MSE | 33683.2170 | 33683.3671 | 33683.6512 |
| VMD-DB4 | SNR | 15.3692 | 15.3736 | 15.3739 |
| VMD-DB4 | MSE | 1903.5285 | 1901.5999 | 1901.4763 |
Table 4.
SNR and MSE values depending on the DWT decomposition level using the Sym4 wavelet: first ECG signal with noise variance 20
| Level 1 | Level 2 | Level 3 | ||
|---|---|---|---|---|
| EMD-Sym4 | SNR | 2.8907 | 2.8906 | 2.8906 |
| EMD-Sym4 | MSE | 33683.0990 | 33683.4726 | 33683.4988 |
| VMD-Sym4 | SNR | 15.3706 | 15.3744 | 15.3748 |
| VMD-Sym4 | MSE | 1902.9217 | 1901.2602 | 1901.0757 |
Table 5.
SNR and MSE values depending on the DWT decomposition level using the DB4 wavelet: second ECG signal with noise variance 10
| Level 1 | Level 2 | Level 3 | ||
|---|---|---|---|---|
| EMD-DB4 | SNR | 5.0057 | 5.0058 | 5.0058 |
| EMD-DB4 | MSE | 20696.9580 | 20696.5336 | 20696.5801 |
| VMD-DB4 | SNR | 21.2452 | 21.2548 | 21.2550 |
| VMD-DB4 | MSE | 491.9994 | 490.9134 | 490.8844 |
Table 6.
SNR and MSE values depending on the DWT decomposition level using the Sym4 wavelet: second ECG signal with noise variance 10
| Level 1 | Level 2 | Level 3 | ||
|---|---|---|---|---|
| EMD-Sym4 | SNR | 5.0057 | 5.0058 | 5.0058 |
| EMD-Sym4 | MSE | 20697.0722 | 20696.5657 | 20696.5026 |
| VMD-Sym4 | SNR | 21.2421 | 21.2535 | 21.2539 |
| VMD-Sym4 | MSE | 492.3405 | 491.0562 | 491.0080 |
Table 7.
SNR and MSE values depending on the DWT decomposition level using the DB4 wavelet: second ECG signal with noise variance 20
| Level 1 | Level 2 | Level 3 | ||
|---|---|---|---|---|
| EMD-DB4 | SNR | 4.9510 | 4.9511 | 4.9511 |
| EMD-DB4 | MSE | 20959.4596 | 20959.0742 | 20958.9975 |
| VMD-DB4 | SNR | 19.2211 | 19.2249 | 19.2270 |
| VMD-DB4 | MSE | 784.1001 | 783.4102 | 783.0280 |
Table 8.
SNR and MSE values depending on the DWT decomposition level using the Sym4 wavelet: second ECG signal with noise variance 20
| Level 1 | Level 2 | Level 3 | ||
|---|---|---|---|---|
| EMD-Sym4 | SNR | 4.9510 | 4.9510 | 4.9511 |
| EMD-Sym4 | MSE | 20959.6115 | 20959.2916 | 20959.1142 |
| VMD-Sym4 | SNR | 19.2205 | 19.2241 | 19.2262 |
| VMD-Sym4 | MSE | 784.2097 | 783.5511 | 783.1767 |
Table 9.
SNR and MSE values depending on the DWT decomposition level using the DB4 wavelet: third ECG signal with noise variance 10
| Level 1 | Level 2 | Level 3 | ||
|---|---|---|---|---|
| EMD-DB4 | SNR | 1.5224 | 1.5224 | 1.5224 |
| EMD-DB4 | MSE | 93050.8652 | 93050.4269 | 93050.3656 |
| VMD-DB4 | SNR | 20.8326 | 20.8575 | 20.8519 |
| VMD-DB4 | MSE | 541.0246 | 537.9388 | 538.6231 |
Table 10.
SNR and MSE values depending on the DWT decomposition level using the Sym4 wavelet: third ECG signal with noise variance 10
| Level 1 | Level 2 | Level 3 | ||
|---|---|---|---|---|
| EMD-Sym4 | SNR | 1.5224 | 1.5224 | 1.5224 |
| EMD-Sym4 | MSE | 93050.6676 | 93050.2675 | 93050.1997 |
| VMD-Sym4 | SNR | 20.8324 | 20.8545 | 20.8389 |
| VMD-Sym4 | MSE | 541.0549 | 538.3017 | 540.2384 |
Table 11.
SNR and MSE values depending on the DWT decomposition level using the DB4 wavelet: third ECG signal with noise variance 20
| Level 1 | Level 2 | Level 3 | ||
|---|---|---|---|---|
| EMD-DB4 | SNR | 1.5329 | 1.5328 | 1.5328 |
| EMD-DB4 | MSE | 93275.1847 | 93274.6451 | 93274.6000 |
| VMD-DB4 | SNR | 17.0451 | 17.0455 | 17.0471 |
| VMD-DB4 | MSE | 1294.1005 | 1293.9791 | 1293.5158 |
Table 12.
SNR and MSE values depending on the DWT decomposition level using the Sym4 wavelet: third ECG signal with noise variance 20
| Level 1 | Level 2 | Level 3 | ||
|---|---|---|---|---|
| EMD-Sym4 | SNR | 1.5329 | 1.5328 | 1.5328 |
| EMD-Sym4 | MSE | 93275.0055 | 93274.5262 | 93274.3113 |
| VMD-Sym4 | SNR | 17.0457 | 17.0460 | 17.0487 |
| VMD-Sym4 | MSE | 1293.9227 | 1293.8423 | 1293.0246 |
Table 13.
SNR and MSE values depending on the DWT decomposition level using the DB4 wavelet: fourth ECG signal with noise variance 10
| Level 1 | Level 2 | Level 3 | ||
|---|---|---|---|---|
| EMD-DB4 | SNR | 3.0218 | 3.0218 | 3.0218 |
| EMD-DB4 | MSE | 131418.6073 | 131418.5735 | 131418.5741 |
| VMD-DB4 | SNR | 28.7612 | 28.7595 | 28.5845 |
| VMD-DB4 | MSE | 87.1689 | 87.2021 | 90.7890 |
Table 14.
SNR and MSE values depending on the DWT decomposition level using the Sym4 wavelet: fourth ECG signal with noise variance 10
| Level 1 | Level 2 | Level 3 | ||
|---|---|---|---|---|
| EMD-Sym4 | SNR | 3.0218 | 3.0218 | 3.0218 |
| EMD-Sym4 | MSE | 131418.5666 | 131418.5632 | 131418.6665 |
| VMD-Sym4 | SNR | 28.7581 | 28.7673 | 28.7417 |
| VMD-Sym4 | MSE | 87.2300 | 87.0465 | 87.5612 |
Table 15.
SNR and MSE values depending on the DWT decomposition level using the DB4 wavelet: fourth ECG signal with noise variance 20
| Level 1 | Level 2 | Level 3 | ||
|---|---|---|---|---|
| EMD-DB4 | SNR | 3.0546 | 3.0545 | 3.0545 |
| EMD-DB4 | MSE | 132414.4638 | 132;414.2288 | 132413.9752 |
| VMD-DB4 | SNR | 16.0172 | 16.0406 | 16.0194 |
| VMD-DB4 | MSE | 1639.6700 | 1630.8619 | 1638.8607 |
Table 16.
SNR and MSE values depending on the DWT decomposition level using the Sym4 wavelet: fourth ECG signal with noise variance 20
| Level 1 | Level 2 | Level 3 | ||
|---|---|---|---|---|
| EMD-Sym4 | SNR | 3.0546 | 3.0546 | 3.0546 |
| EMD-Sym4 | MSE | 132414.5087 | 132414.3851 | 132414.4224 |
| VMD-Sym4 | SNR | 16.0206 | 16.0383 | 16.0268 |
| VMD-Sym4 | MSE | 1638.3949 | 1631.7233 | 1636.0790 |
Table 17.
SNR and MSE values depending on the DWT decomposition level using the DB4 wavelet: fifth ECG signal with noise variance 10
| Level 1 | Level 2 | Level 3 | ||
|---|---|---|---|---|
| EMD-DB4 | SNR | 10.9169 | 10.9169 | 10.9169 |
| EMD-DB4 | MSE | 809421.5499 | 809421.3385 | 809421.2257 |
| VMD-DB4 | SNR | 22.5746 | 22.5966 | 22.5719 |
| VMD-DB4 | MSE | 362.2579 | 360.4261 | 362.4816 |
Table 18.
SNR and MSE values depending on the DWT decomposition level using the Sym4 wavelet: fifth ECG signal with noise variance 10
| Level 1 | Level 2 | Level 3 | ||
|---|---|---|---|---|
| EMD-Sym4 | SNR | 10.9169 | 10.9169 | 10.9169 |
| EMD-Sym4 | MSE | 809421.3898 | 809421.0519 | 809421.2054 |
| VMD-Sym4 | SNR | 22.5717 | 22.5914 | 22.5722 |
| VMD-Sym4 | MSE | 362.4999 | 360.8572 | 362.4583 |
Table 19.
SNR and MSE values depending on the DWT decomposition level using the DB4 wavelet: fifth ECG signal with noise variance 20
| Level 1 | Level 2 | Level 3 | ||
|---|---|---|---|---|
| EMD-DB4 | SNR | 10.9942 | 10.9942 | 10.9942 |
| EMD-DB4 | MSE | 823954.7781 | 823954.5903 | 823953.3942 |
| VMD-DB4 | SNR | 14.7856 | 14.7963 | 14.7915 |
| VMD-DB4 | MSE | 2177.3058 | 2171.9394 | 2174.3733 |
Table 1.
SNR and MSE values depending on the DWT decomposition level using the DB4 wavelet: first ECG signal with noise variance 10
| Level 1 | Level 2 | Level 3 | ||
|---|---|---|---|---|
| EMD–DB4 | SNR | 3.2753 | 3.2753 | 3.2753 |
| EMD–DB4 | MSE | 30828.5930 | 30828.1368 | 30828.0466 |
| VMD-DB4 | SNR | 23.5503 | 23.5597 | 23.5474 |
| VMD-DB4 | MSE | 289.3658 | 288.7396 | 289.5618 |
Table 20.
SNR and MSE values depending on the DWT decomposition level using the Sym4 wavelet: fifth ECG signal with noise variance 20
| Level 1 | Level 2 | Level 3 | ||
|---|---|---|---|---|
| EMD-Sym4 | SNR | 10.9942 | 10.9942 | 10.9942 |
| EMD-Sym4 | MSE | 823955.0717 | 823954.9560 | 823954.7459 |
| VMD-Sym4 | SNR | 14.7846 | 14.7969 | 14.7925 |
| VMD-Sym4 | MSE | 2177.8341 | 2171.6420 | 2173.8296 |
Table 21.
SNR and MSE values based on the NLM technique
| ECG signals | Performance metric | Noise variance = 10 | Noise variance = 20 |
|---|---|---|---|
| 1st | SNR | 28.27660 | 22.12515 |
| 1st | MSE | 97.45846 | 401.75795 |
| 2nd | SNR | 28.23162 | 22.42448 |
| 2nd | MSE | 98.47328 | 375.00076 |
| 3rd | SNR | 28.34325 | 22.28176 |
| 3rd | MSE | 95.97435 | 387.52915 |
| 4th | SNR | 28.50518 | 22.65744 |
| 4th | MSE | 92.46176 | 355.41536 |
| 5th | SNR | 28.18979 | 22.46675 |
| 5th | MSE | 99.42625 | 371.36861 |
4. Conclusion
A number of studies have taken advantage of the hybrid EMD–DWT approach for ECG signal enhancement. In such an approach, the EMD is employed as an adaptive technique for ECG decomposition, whereas the DWT is used for denoising based on a given thresholding criterion. Recently, the VMD has been proposed as an adaptive multiresolution technique to overcome some of the limits of the EMD such as sensitivity to noise. This Letter compared the EMD–DWT against the VMD-DWT approach in denoising a real ECG signal, corrupted with three levels of Gaussian noise. Indeed, this Letter is the first to apply VMD in the problem of ECG signal denoising. We relied on adaptive multiresolution techniques (EMD, VMD) for ECG decomposition because of their ability to adjust to unknown signal characteristics varying over time. For comparison purposes, the non-local means algorithm is used for denoising a noisy ECG signal. Five ECG signals obtained from PhysioNet were chosen to conduct our study. Experimental results evaluated by using SNR and MSE showed that the best performance was obtained by the NLM technique followed by the VMD-DWT approach. However, they achieved comparable performances. The conventional EMD–DWT techniques performed the worst.
Our study can be extended in future work by considering different values used to determine the number of variational modes used to obtain results. Indeed, the VMD is still faced with the difficulty of parameter choice, which will be our further research avenue for the application and improvement of the VMD-DWT technique. As this Letter presents a preliminary study, future work will also consider other types of biological signals.
5. Acknowledgments
The authors thank the authors in [20] for providing codes to run the VMD algorithm.
6 References
- 1.Friesen G.M., Jannett T.C., Jadallah M.A.: ‘A comparison of the noise sensitivity of nine QRS detection algorithms’, IEEE Trans. Biomed. Eng., 1990, 37, (1), pp. 85–98 (doi: ) [DOI] [PubMed] [Google Scholar]
- 2.Leski J.M., Henzel N.: ‘ECG baseline wander and power line interference reduction using nonlinear filter bank’, Signal Process., 2004, 35, (4), pp. 781–793 [Google Scholar]
- 3.Barros A.K., Mansour A., Ohnishi N.: ‘Removing artifacts from electrocardio-graphic signals using independent components analysis’, Neurocomputing, 1998, 22, pp. 173–186 (doi: ) [Google Scholar]
- 4.He T., Clifford G., Tarassenko L.: ‘Application of ICA in removing artefacts from the ECG’. Neural Processing Letters, 2006, pp. 105–116 [Google Scholar]
- 5.Hamilton P.S.: ‘A comparison of adaptive and non adaptive filters for reduction of power line interference in the ECG’, IEEE Trans. Biomed. Eng., 1996, 43, (1), pp. 105–109 (doi: ) [DOI] [PubMed] [Google Scholar]
- 6.Ziarani A.K., Konrad A.: ‘A nonlinear adaptive method of elimination of power line interference in ECG signals’, IEEE Trans. Biomed. Eng., 2002, 49, (6), pp. 540–547 (doi: ) [DOI] [PubMed] [Google Scholar]
- 7.Alfaouri M., Daqrouq K.: ‘ECG signal denoising by wavelet transform thresholding’, Ame. J. Appl. Sci., 2008, 5, (3), pp. 276–281 (doi: ) [Google Scholar]
- 8.Poornachandra S.: ‘Wavelet-based denoising using subband dependent threshold for ECG signals’, J. Digital Signal Process., 2008, 18, pp. 49–55 (doi: ) [Google Scholar]
- 9.Poornachandra S., Kumaravel N.: ‘A novel method for the elimination of power line frequency in ECG signal using hyper shrinkage function’, J. Digital Signal Process., 2008, 18, pp. 116–126 (doi: ) [Google Scholar]
- 10.Blanco-Velasco M., Weng B., Barner K.E.: ‘ECG signal denoising and baseline wander correction based on the empirical mode decomposition’, Comput. Biol. Med., 2008, 38, (1), pp. 1–13 (doi: ) [DOI] [PubMed] [Google Scholar]
- 11.Li N., Li P.: ‘An improved algorithm based on EMD-wavelet for ECG signal de-noising’. Proc. Int. Joint Conf. on Computational Sciences and Optimization, 2009, pp. 825–827 [Google Scholar]
- 12.Kabir M.A., Shahnaz C.: ‘Denoising of ECG signals based on noise reduction algorithms in EMD and wavelet domains’, Biomed. Signal Process. Control, 2012, 7, pp. 481–489 (doi: ) [Google Scholar]
- 13.Suchethaa M., Kumaravel N.: ‘Empirical mode decomposition based filtering techniques for power line interference reduction in electrocardiogram using various adaptive structures and subtraction methods’, Biomed. Signal Process. Control, 2013, 8, pp. 575–585 (doi: ) [Google Scholar]
- 14.Kopsinis Y., McLaughlin S.: ‘Development of EMD-based denoising methods inspired by wavelet thresholding’, IEEE Trans. Signal Process., 2009, 57, (4), pp. 351–1362 (doi: ) [Google Scholar]
- 15.Clifford G.D., Azuaje F., McSharry P.E.: ‘Advanced methods and tools for ECG data analysis’ (Artech House, Boston/London, 2006) [Google Scholar]
- 16.Huang N.E., Shen Z., Long S.R., et al. : ‘The empirical mode composition and the Hilbert spectrum for nonlinear and non-stationary time series analysis’. Proc. of the Royal Society London, 1998, Vol. A 454, pp. 903–995 [Google Scholar]
- 17.Yan Y., Zhanzhong C.: ‘Noise and zero excursion elimination of electrostatic detection signals based on EMD and wavelet transform’. IEEE Int. Congress on Image and Signal Processing, 2009, pp. 1–5 [Google Scholar]
- 18.Sun M., Shen Y., Zhang W.: ‘A wavelet threshold denoising method for ultrasonic signal based on EMD and correlation coefficient analysis’. Proc. IEEE Third Int. Congress on Image and Signal Processing, 2010, pp. 3992–3996 [Google Scholar]
- 19.Demir B., Ertürk S., Güllü K.: ‘Hyperspectral image classification using denoising of intrinsic mode functions’, IEEE Geosci. Remote Sens. Lett., 2011, 8, (2), pp. 220–224 (doi: ) [Google Scholar]
- 20.Dragomiretskiy K., Zosso D.: ‘Variational mode decomposition’, IEEE Trans. Signal Process., 2014, 62, pp. 531–544 (doi: ) [Google Scholar]
- 21.Tracey B.H., Miller E.L.: ‘Nonlocal means denoising of ECG signals’, IEEE Trans. Biomed. Eng., 2012, 59, (9), pp. 2383–2386 (doi: ) [DOI] [PubMed] [Google Scholar]
- 22.Luisier F., Blu T., Unser M.: ‘A new SURE approach to image denoising: interscale orthonormal wavelet thresholding’, IEEE Trans. Image Process., 2007, 16, pp. 593–606 (doi: ) [DOI] [PubMed] [Google Scholar]
- 23.Stein C.: ‘Estimation of the mean of a multivariate normal distribution’, Ann. Stat., 1981, 9, pp. 1135–1151 (doi: ) [Google Scholar]
- 24.Donoho D.L., Johnstone I.M.: ‘Adapting to unknown smoothness via wavelet shrinkage’, J. Ame. Stat. Assoc., 1995, 90, pp. 1200–1224 (doi: ) [Google Scholar]
- 25.Kabir M.A., Shahnaz C.: ‘Comparison of ECG signal denoising algorithms in EMD and wavelet domains’, IJRRAS, 2012, 11, pp. 499–516. [Google Scholar]
- 26.Daubechies I.: ‘Ten lectures on wavelets’ (Society of Industrial and Applied Mathematics (SIAM; ), Philadelphia, Pennsylvania, 1992) [Google Scholar]
- 27.http://www.physionet.org/physiobank/database/mitdb/
- 28.Van De Ville D., Kocher M.: ‘SURE-based nonlocal means’, IEEE Signal Process. Lett., 2009, 16, (11), pp. 973–976 (doi: ) [Google Scholar]


