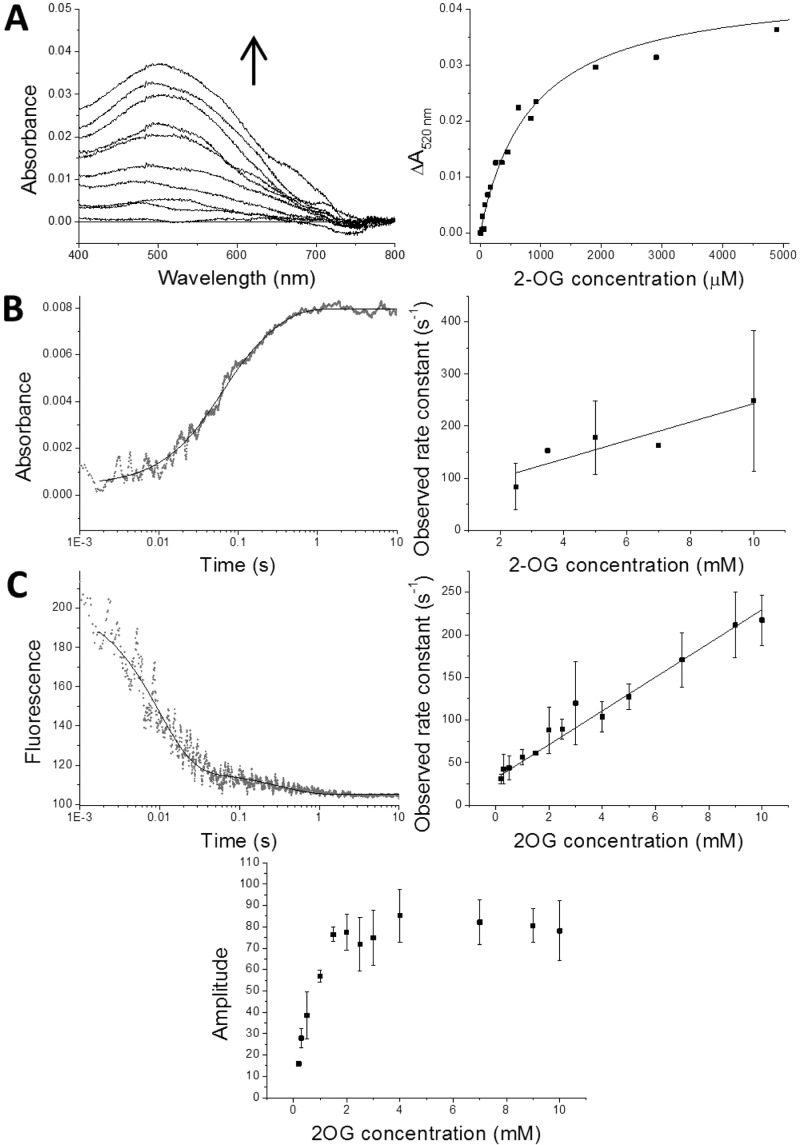
Figure 6.
Kinetic studies of MLCT complex formation. (A) Titration of 2-OG into a solution of vCPH in complex with Fe(II). The left-hand plot shows the difference spectra of vCPH after increasing concentrations of 2-OG are added to a vCPH Fe(II) solution. Spectra shown are samples with 0–5 mM 2-OG present. The right-hand plot shows the absorbance values at 520 nm vs 2-OG concentration. The data were fitted to the Morrison equation (eq 2), which is shown as a black line. Conditions: 150 μM vCPH, 200 μM FeSO4 in 0.5 M NaCl, 50 mM Tris, 10% (v/v) glycerol buffer (pH 7.6) at 25 °C under anaerobic conditions. (B) Dependence of the observed rate constant on the concentration of 2-OG during MLCT complex formation. The left-hand plot shows single-wavelength transients at 520 nm for the formation of the MLCT complex after vCPH, in complex with Fe(II), is mixed with 2-OG in a stopped flow. The data were fitted to an exponential equation (eq 3). The right-hand plot shows the observed rate constants of formation at 520 nm of the first faster phase vs 2-OG concentration. Final conditions: 200 μM vCPH, 250 μM FeSO4 in 50 mM Tris, and 0.5 M NaCl (pH 7.6) at 10 °C mixed with varying concentrations of 2-OG under anaerobic conditions. (C) 2-OG concentration dependence of the transient state kinetics of vCPH tryptophan quenching upon MLCT complex formation. The top left-hand plot is an example of transients measured when vCPH in complex with Fe(II) was mixed with 2-OG in the stopped flow. The data were fitted to an exponential equation (eq 3). The top right-hand plot shows the observed rate constants of tryptophan quenching for the first faster phase vs 2-OG concentration, and the bottom plot shows their respective amplitudes. Final conditions: 5 μM vCPH, 20 μM FeSO4 mixed with varying concentrations of 2-OG in a 50 mM Tris, 0.5 mM NaCl buffer (pH 7.6) under anaerobic conditions at 10 °C. Samples were excited at 295 nm, and fluorescence at 350 nm was measured.

