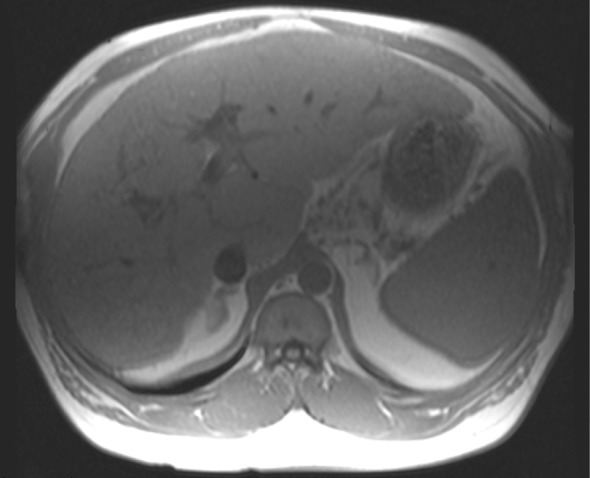
Figure 10b.

Type II chemical shift artifact. Axial dual-echo out-of-phase (echo time, 2.2 msec) (a) and in-phase (echo time, 4.4 msec) (b) gradient-echo MR images of the abdomen showing fat and water were obtained at 1.5 T. The out-of-phase image shows the characteristic black border outlining the fat-water interfaces that is due to the differences in chemical shift between fat and water in the same voxel.
