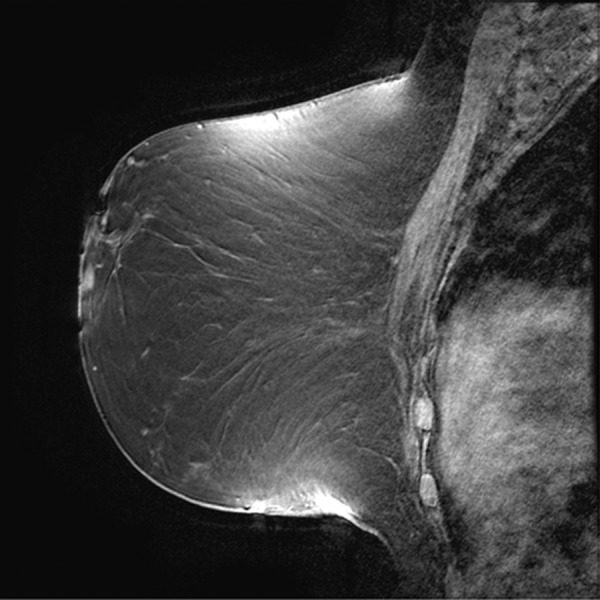
Figure 11a.

Poor fat suppression. (a, b) Sagittal (a) and axial (b) MR images show that B0 inhomogeneity leads to poor fat suppression in the breasts at the edges of the FOV. (c) Axial short inversion time inversion-recovery (STIR) MR image shows improved fat suppression with STIR.
