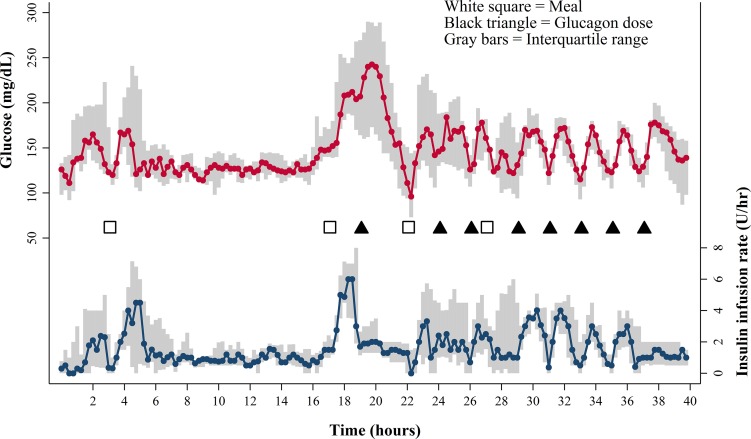
Figure 1.
Median venous blood glucose values in milligrams per deciliter (top graph) and median insulin infusion rates in units per hour (bottom graph). The interquartile range is shown in gray. Meals (white squares) and glucagon doses (black triangles) are also shown. Note that glucose levels consistently rose after each glucagon dose. The insulin infusion rate was fixed after the first and last glucagon dose, but was otherwise adjusted to bring the glucose concentration into the target range.

