. 2015 Sep 22;4:e07340. doi: 10.7554/eLife.07340

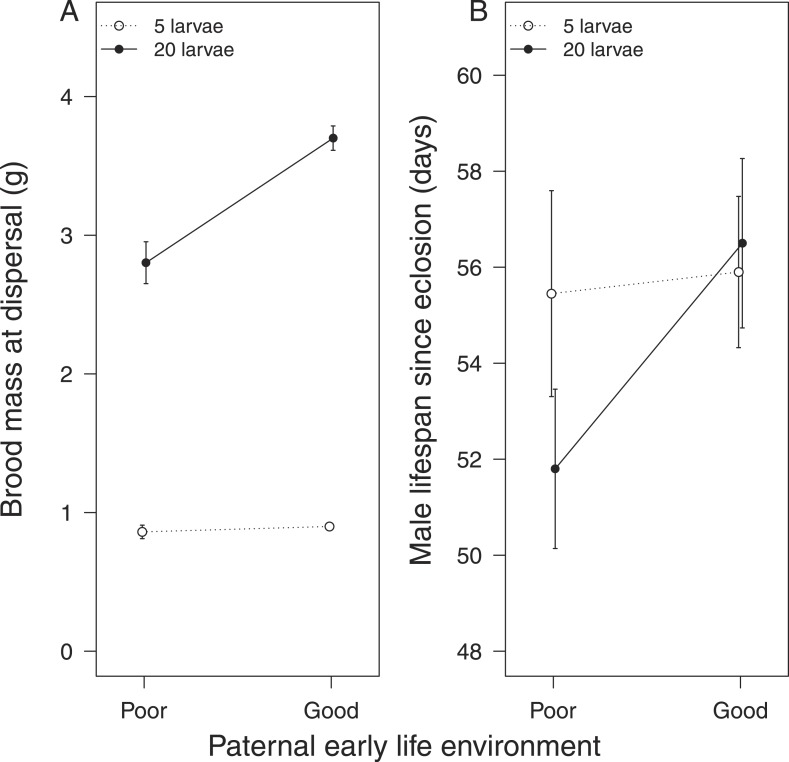
Figure 1. Overview of the model structure, including mortality and survival (A) and reproduction (B).

DOI: http://dx.doi.org/10.7554/eLife.07340.003

Figure 1.

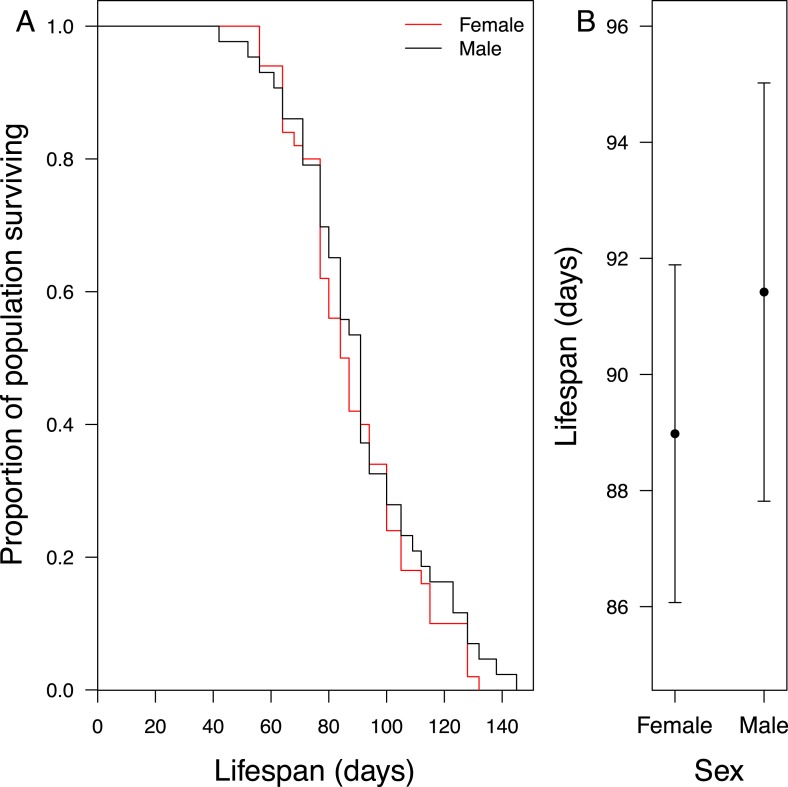
Figure 1—figure supplement 1. Longevity of adult virgin males (n = 43) and females (n = 50) (A) shown as a cumulative survival plot and (B) comparing mean ± S.E.M lifespan for each sex.

Figure 1—figure supplement 1.

The rate at which the beetles died was not significantly different, nor was there a difference in their mean lifespan (X2 = 0.69, d.f. = 1, p = 0.41). These data were collected from an experiment in which individuals were removed at eclosion from 13 different families at random, with each family contributing between 2 and 13 experimental subjects. The experimental subjects were weighed and kept under standard conditions (see ‘Materials and methods’) until they died. The population was censused twice a week. In the statistical analyses reported above, body mass at eclosion and sex were fixed terms and family of origin was a random term, using the R package coxme (see ‘Materials and methods’).
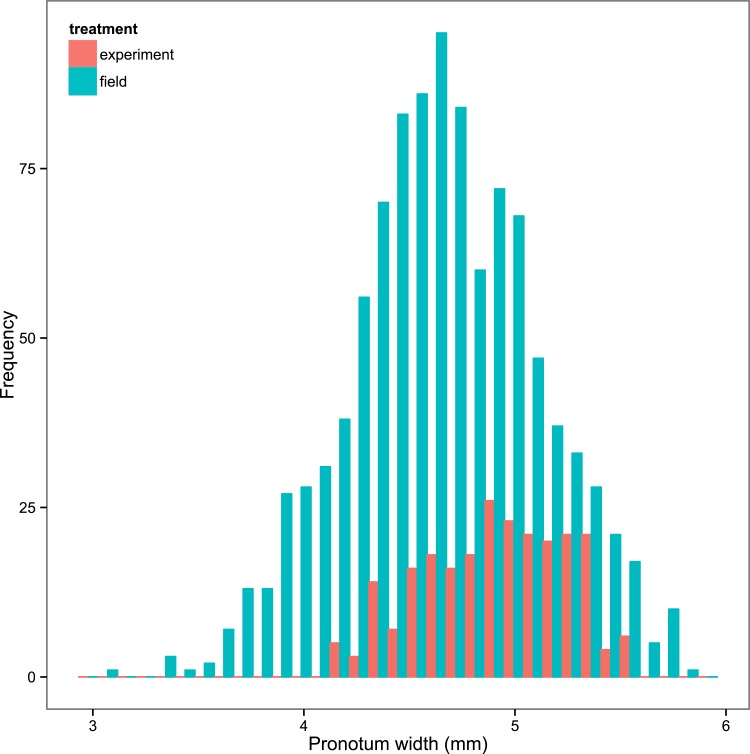
Figure 1—figure supplement 2. Frequency distribution of the size of field-caught N. vespilloides (shown in blue) and the experimental N. vespilloides described in this study (shown in red).

Figure 1—figure supplement 2.

The size of the beetle is given by its pronotum width. There is no sexual size dimorphism, so the data for males and females have been pooled. Our experimental treatments generated beetles that were well within the range of size of beetles that occur naturally.