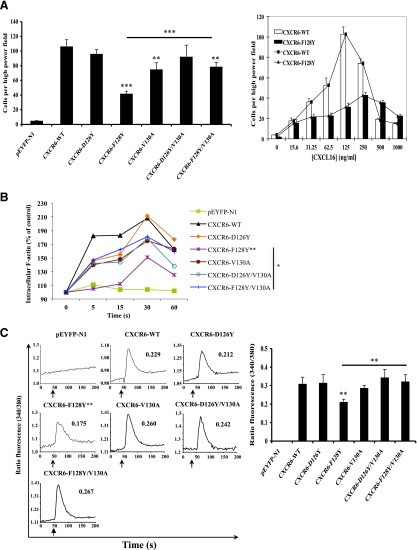
Fig. 3.
CXCR6-F128Y has impaired activity when expressed in HEK-293T cells. (A) Cells were transfected with equal amounts of DNA encoding wild-type and mutant CXCR6-YFP proteins. Migration was measured using a microchemotaxis chamber with polycarbonate membranes and containing CXCL16 in the lower wells, as described in Materials and Methods. The left panel shows mean ± S.E.M. of data from four experiments. The asterisks indicate a significant difference from HEK-293T cells expressing wild-type receptor and, as indicated by the bar, between CXCR6-F128Y and CXCR6-F128Y/V130A mutants. The right panel shows mean ± S.E.M. for chemotaxis using various concentrations of CXCL16 from three experiments using cells expressing wild-type or CXCR6-F128Y receptors. (B) Cells transfected as in (A) were fixed and stained with Alexa Fluor 488 phalloidin-paraformaldehyde at the indicated time points after stimulation with 2.5 μg/ml CXCL16, as described in Materials and Methods. All results are plotted relative to the mean fluorescence intensity of the sample without the addition of CXCL16, which was set at 100% and plotted at 0 seconds. The data shown are from one of three experiments. Mean responses at each time point were calculated from the three experiments, and the asterisks indicate significant differences between the curves for F128Y versus wild-type receptors and, as indicated by the bar, for the mutants F128Y versus F128Y/V130A. (C) Cells were transfected with variable amounts of DNAs encoding wild-type and mutant CXCR6-YFP proteins to produce equal surface expression. In the experiment shown in the left panel, cells were loaded with Fura-2/AM and assayed for intracellular calcium mobilization on a spectrofluorometer in response to 1 μg/ml CXCL16 added at the times indicated by the arrows, as described in Materials and Methods. The numbers in each panel show peak changes in the fluorescence ratios. This experiment is representative of four. Mean peak responses were calculated from the four experiments, and the asterisks indicate significant differences between F128Y versus wild-type receptors and, as indicated by the bar, the mutants F128Y versus F128Y/V130A (right panel). *P < 0.05; **P < 0.01; ***P < 0.001.

