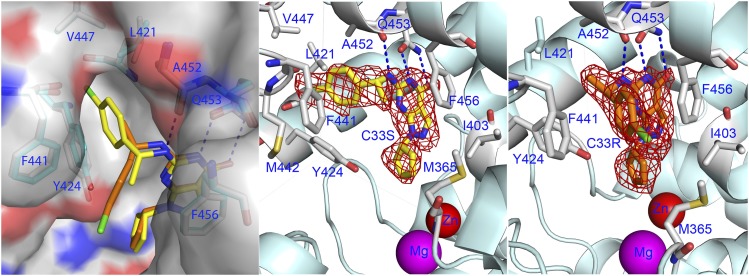
Fig. 3.
Binding of C33 to PDE9A. (A) Surface presentation on binding of (R)-C33 (orange sticks) and (S)-C33 (yellow) to PDE9 dimers. (R)-C33 and (S)-C33 showed unique conformation in the PDE9 dimer structures, but in the PDE9 dimer in the complex with racemic C33, (R)-C33 binds subunit B and (S)-C33 binds subunit A. The gray and cyan sticks represent the key residues involved in binding. Dotted lines represent hydrogen bonds. (B) Ribbon model for (S)-C33 binding to the PDE9 dimer. The red mesh is the electron density in the difference (Fo − Fc) map that was calculated from the structure with omission of (S)-C33 and contoured at 3σ. (C) Binding of (R)-C33 to subunit B of the PDE9 dimer.

