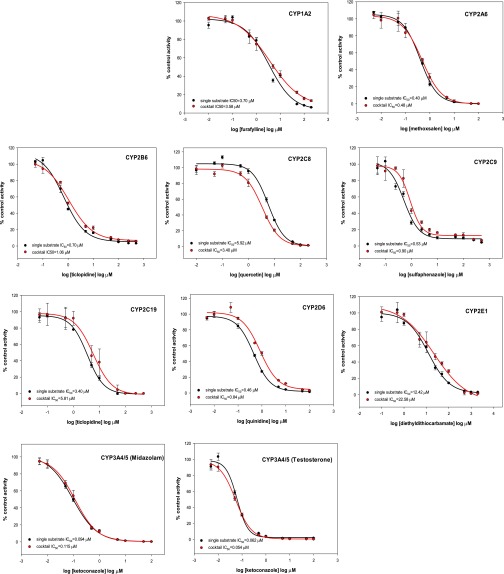
Fig. 3.
Inhibition curves of known inhibitors obtained using single substrates and substrate cocktails. Each inhibitor was incubated in separate experiments with single substrates or the substrate cocktail. The activity is expressed as a percentage of remaining activity compared with the control containing no inhibitor. Experiments were carried out three times.

