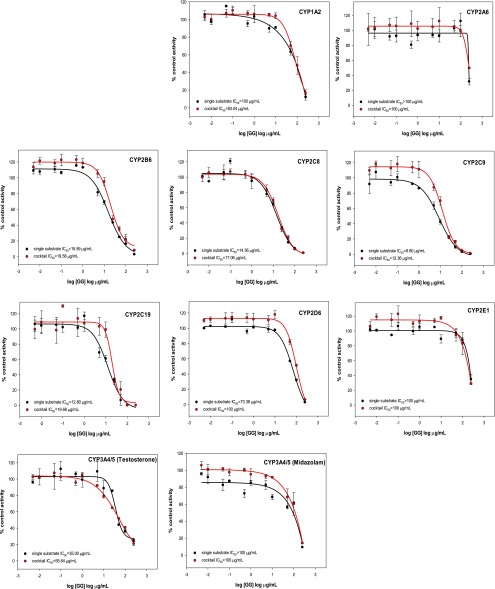
Fig. 4.
Inhibition curves of a licorice root extract obtained using single substrates or the substrate cocktail. Each inhibitor was incubated in separate experiments with a single substrate or the substrate cocktail. The activity is shown as a percentage of remaining activity compared with the control when no inhibitor was added. Experiments were carried out three times. GG = Glycyrrhiza glabra extract.

