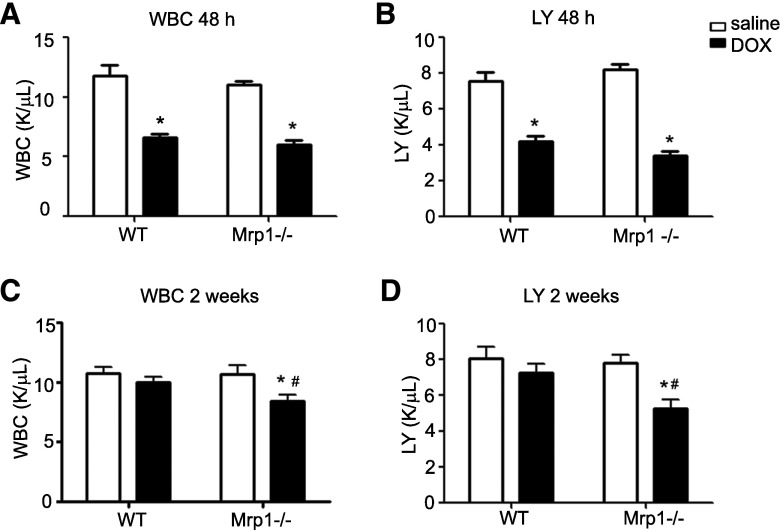
Fig. 3.
The effects of DOX on WBC and lymphocyte counts. Mice were treated with protocol B, and WBC and lymphocyte counts were measured 48 hours (A and B) and 2 weeks (C and D) after the last DOX dose. Each bar represents the mean ± S.E. (n = 8 for the saline-treated group; n = 12 for the DOX-treated group). *P < 0.05 DOX versus saline of the same genotype; #P < 0.05 Mrp1−/− versus respective WT mice by Newman–Keuls multiple comparison test after one-way analysis of variance. K/µl, 1000 cells per microliter; LY, lymphocyte.

