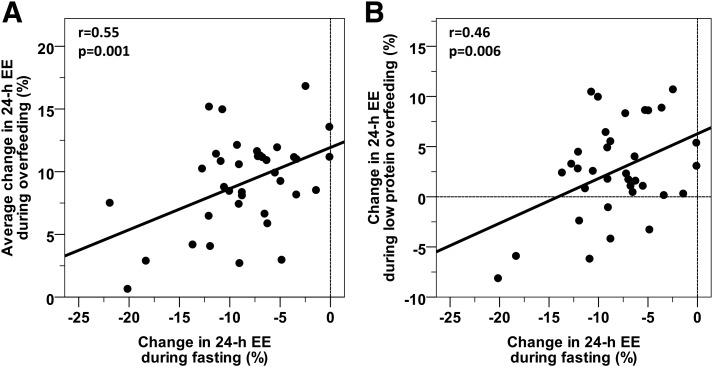
Figure 4.
Inverse relationships between the 24-h EE response to FST and the average change in 24-h EE during overfeeding (A) and during low-protein overfeeding (B). The 24-h EE response to FST and to overfeeding is expressed as the percentage change compared with the 24-h EE measured during EB. The average change in 24-h EE during overfeeding was calculated as the mean value across the four overfeeding diets. The best-fit line is displayed in both panels. Vertical and horizontal lines indicate points with no change in 24-h EE compared with EB.

