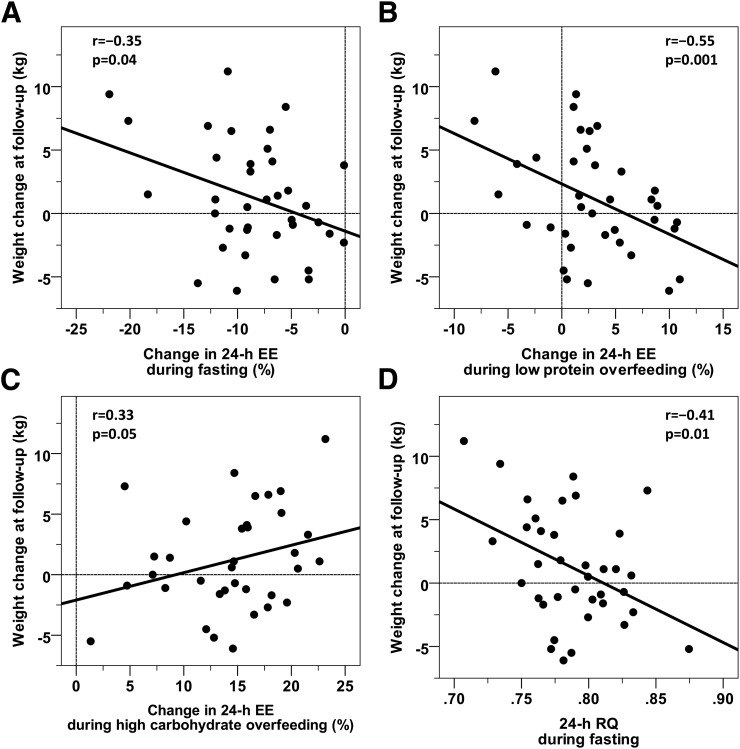
Figure 5.
Associations between body weight change after 6 months and the 24-h EE responses to overfeeding and FST. Inverse associations between weight change at 6 months after discharge from the CRU and the change in 24-h EE with FST (A) and during low-protein overfeeding (B). C: Positive relationship between the increase of 24-h EE with high-carbohydrate overfeeding and weight change (two high-carbohydrate diets were excluded as <95% of the food was consumed). D: Inverse relationship between RQ during 24 h of FST and weight change. The mean follow-up time was 6.5 ± 0.9 months with a weight change of 1.2 ± 4.2 kg (range −6.1 to 11.2 kg). No point met the statistical criteria to be an outlier. All associations were still significant (P < 0.05) when excluding the subjects with the greatest weight change. The results for weight change, expressed as a percentage of the baseline weight, are as follows: %EE response to FST (r = −0.36, P = 0.03), low-protein overfeeding (r = −0.51, P = 0.007), high-carbohydrate overfeeding (r = 0.34, P = 0.05), and RQ during FST (r = −0.44, P = 0.006).

