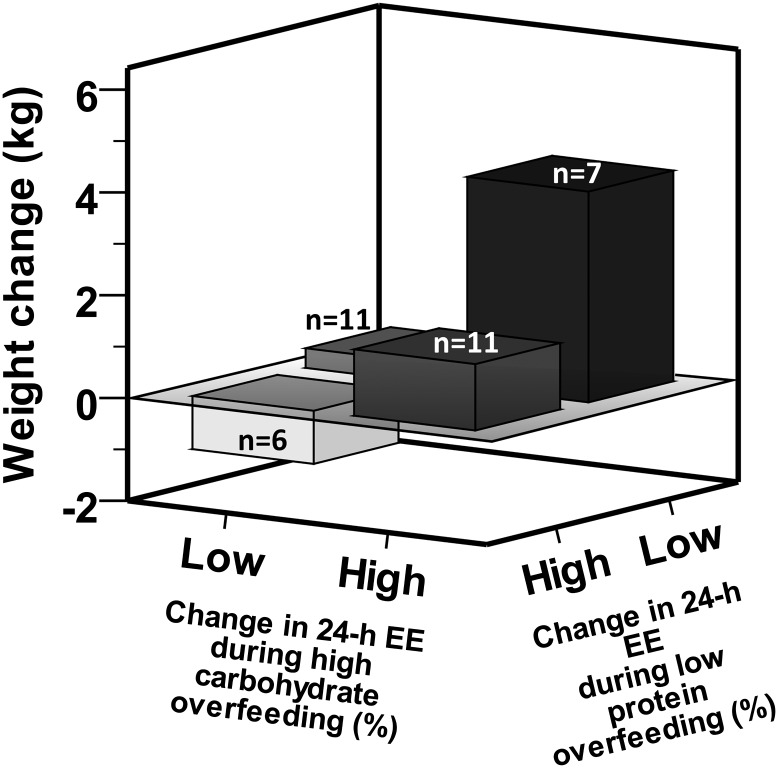
Figure 6.
Phenotypes of 6-month weight change based on the 24-h EE responses to low-protein and high-carbohydrate overfeeding. Subjects were categorized into four subgroups according to the median %EE during low-protein and high-carbohydrate, normal-protein overfeeding (two high-carbohydrate diets were excluded as <95% of the food was consumed). Subjects with a lower-than-median EE response during low-protein overfeeding and a higher-than-median response during high-carbohydrate, normal-protein overfeeding gained more weight compared with those with the opposing EE responses (mean difference 7% increase in their baseline weight, P = 0.007). The mean follow-up time was 6.5 ± 0.9 months, with a weight change of 1.2 ± 4.2 kg (range −6.1 to 11.2 kg).

