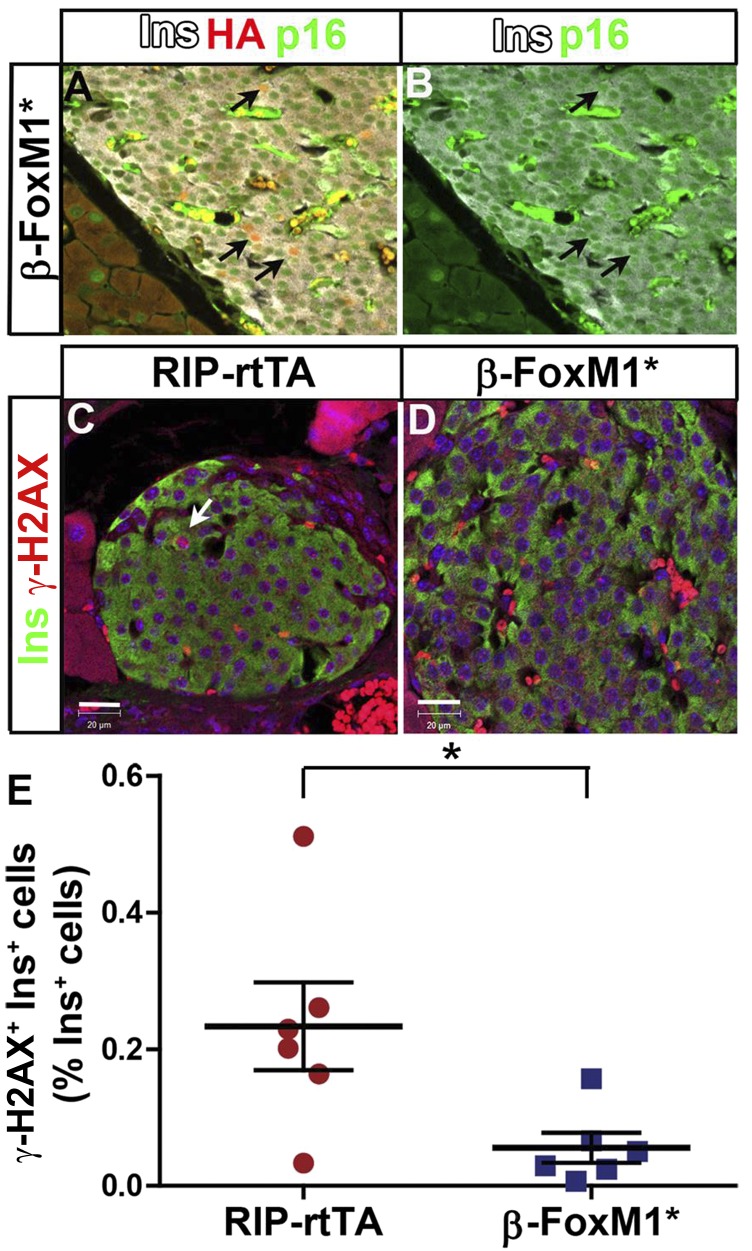
Figure 4.
FoxM1 decreases γ-H2AX with no change in p16. A: Insulin (Ins), HA, and p16 labeling on 12-month-old and β-FoxM1* pancreas sections. B: Single-channel labeling of p16 from image in A. The black arrows indicate β-cells positive for p16 and activated FoxM1. Images were acquired at original magnification ×200. Insulin and γ-H2AX labeling on RIP-rtTA (C) and β-FoxM1* (D) pancreas sections. The white arrow indicates a cell positive for insulin and γ-H2AX. E: Quantification of γ-H2AX+ β-cells. Scale bar: 20 µm. *P < 0.05.

