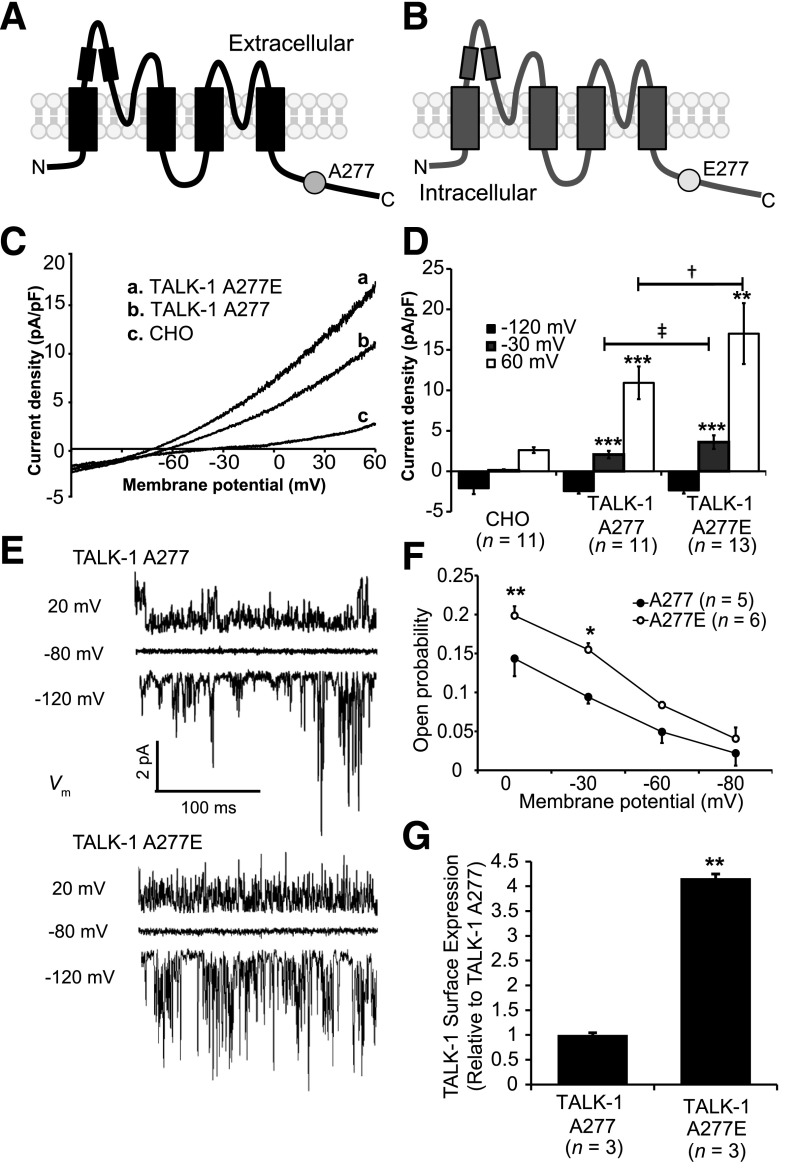
Figure 3.
TALK-1 A277E shows increased open probability and surface expression. A and B: Illustration of a TALK-1 A277 channel subunit (A) and a TALK-1 channel subunit showing the location of the rs1535500 polymorphism, which results in an A277E substitution in the TALK-1 Ct (B). C: TALK-1 current recordings from CHO cells expressing TALK-1 A277, TALK-1 A277E, or control mCherry in response to a voltage ramp from −120 mV to 60 mV. D: Quantification of current density at selected membrane potentials in CHO cells expressing TALK-1 A277 or TALK-1 A277E. **P < 0.005 vs. CHO; ***P < 0.001 vs. CHO; ‡P < 0.001 vs. TALK-1 A277; †P < 0.0001 vs. TALK-1 A277. E: Representative single-channel recordings from an attached patch of HEK293 cells expressing TALK-1 A277 or TALK-1 A277E in response to indicated voltage steps. F: Quantification of Po at indicated membrane potentials. Note that Po is significantly elevated at Vm values where β-cell APs fire. G: Quantification of FLAG-tagged TALK-1 A277 and E277 surface expression. Data are mean ± SEM. *P < 0.05; **P < 0.005.

