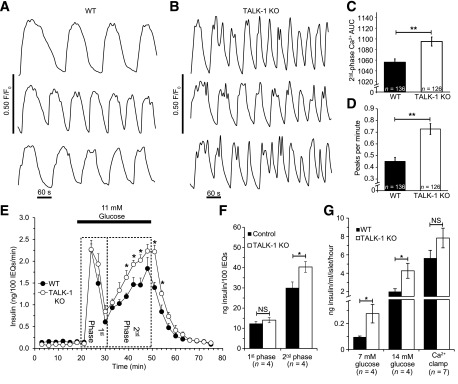
Figure 5.

[Ca2+]i influx, oscillation frequency, and GSIS are increased in TALK-1–deficient islets. A and B: Representative [Ca2+]i recordings in islets from WT (A) and TALK-1 KO (B) mice stimulated with 14 mmol/L glucose. C: Area under the curve (AUC) quantification of second-phase Ca2+ influx in control and TALK-1 KO islets; Ca2+ area under the curve was calculated in the first ∼15 min of glucose-stimulated Ca2+ influx after regular [Ca2+]i oscillations commenced (14 mmol/L glucose). D: Quantification of [Ca2+]i oscillation frequency in control and TALK-1 KO islets. E: GSIS in isolated WT and TALK-1 KO islets. Islets were perifused with 1 mmol/L glucose and stimulated with 11 mmol/L glucose. The insulin concentration was determined by radioimmunoassay. F: Area under the curve quantification of first- and second-phase insulin secretion for periods indicated on the graph. G: Insulin secretion from WT and TALK-1 KO islets in static incubation; “Ca2+ clamp” consisted of treatment with 14 mmol/L glucose, 30 mmol/L KCl, and 200 μmol/L diazoxide. N islet preparations per genotype are reported in the figure. Data are mean ± SEM. *P < 0.05, **P < 0.005. IEQs, islet equivalents; NS, not significant.
